.avif)


.png)

.png)


.avif)


With inputs from Prayat Shah, Head of Healthcare at Plum
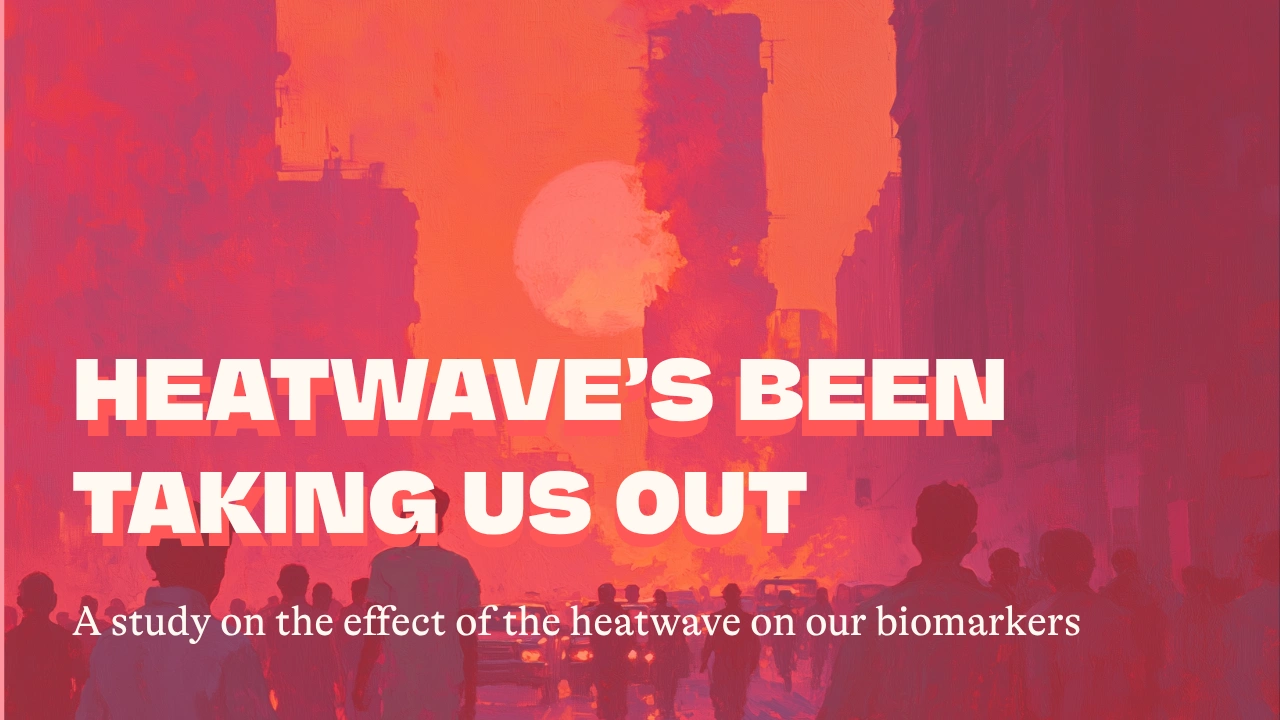
How the summer heat affects our underlying biomarkers, and what that means for you.
The Indian summer has become oppressive. In Tamil Nadu, where I’m from, this period is called the Agni Natachtram, known for soaring heat, searing temperatures, and dry winds. This period has different names in different parts of the country – kathari in Andhra Pradesh and Telangana, where temperatures hit 40+ degrees, and loo in the north, characterized by dry winds across the Indo-Gangetic winds.
Across the country, this year has been particularly unbearable – by April, all 50 of the world’s hottest cities were in India. Thanks to El Niño conditions, a weakened monsoon cycle, the urban heat island effect, and decades of deforestation, the Indian summer has become a public health emergency.
Unfortunately, for a lot of us, life goes on. There is no respite as we continue to commute to work, run our daily errands, and go about our lives. With this in mind, we wanted to understand what the heat was doing, quietly and measurably, to our bodies, and what we could do to reduce the impact it had on our health. Over the last twelve months, Plum has processed over 22,167 health checkups covering 100+ biomarkers. This gave us a unique vantage point to understand how specific biomarkers relevant to heat stress and dehydration responded to the heatwave this year.
In this analysis, we’ve attempted to eliminate demographic drift to the best of our abilities by using a matched pair analysis for age, city, gender, and the type of health checkup a user books. We acknowledge that there will be a certain modicum of bias that we cannot capture – underlying physiological conditions, different tolerances to heat in different regions, and other exposure to risk induced by lifestyle. We’d love your feedback and additional data sources to make this study more robust.
How the heatwave affects hydration, electrolytes, and blood related biomarkers.
The chart below shows how each biomarker moves month by month from October 2025 through May 2026. The orange shading marks the heatwave window (March–May). The dotted line in each panel is the October–February baseline average. Each data point is the percentage of patients that month whose result was abnormal.
Three patterns were evident across the chart:
- A steady ramp from winter into summer: most visible in Concentrated Urine, which climbs almost continuously from October to April.
- A sharp step-change in March: Haemoglobin, Hematocrit, and Iron all jump noticeably in March, consistent with the body beginning its plasma-volume expansion as ambient temperatures rise before the official heatwave peak.
- A sustained plateau through April–May: most biomarkers hold their elevated levels across both months rather than spiking and dropping, suggesting this is a population-level seasonal shift, not random noise.
Most of these biomarkers are consistent with heatwave induced dehydration, according to our panel of doctors. These findings are also consistent with an increased frequency of telehealth consultations related to heat exhaustion. The simplest fix, according to Dr. Anirudh Anilkumar, is to ensure hydration is taken care of.
"Dehydration is still the most likely culprit for most of these deranged biomarkers, such as elevated serum calcium, concentrated urine, and acidic urine. Drinking more water is an easy, necessary fix for this. But how much water is a function of how much water and sodium you lose through sweating. The kidneys are great at controlling electrolyte and water levels excreted through urine, but have no real control on sweating. So if you are sweating more than the average office-worker in summer, it might be helpful to get some ORS or coconut water or a salty nimbu-paani once a day to supplement electrolytes. Of course, this is not a reason to chug large quantities of Gatorade or Prime!"
—Dr. Anirudh Anilkumar, Consulting Doctor, Plum Telehealth
Comparing winter and summer patients
To make this comparison fair, summer patients were matched to winter patients of the same gender and age, and (where relevant) the same health checkup package. This was done to reduce the impact of demographic drift, and ensure that the deviations were due to temperature differences alone.
A one-hour commute to work in the morning is a lot more draining than usual, you’re forced to sub yourself out 25 minutes into the football game you’ve been looking forward to, elder members in your family are more anxious than usual because the heat is causing considerable discomfort. The heat’s impact on our body makes seemingly simple tasks a lot harder, affecting all aspects of our life – from the nature of our work to the quality of our sleep. And a lot of it can be attributed to the subtle changes in our bodily chemistry.
"We've been talking about debilitating impact of India's heatwave for a while now, and evidence points towards this getting worse over the years. Anecdotal evidence and notes from our consulting doctors showed that more Indians were facing the impact of the heat, and our analysis is a clear indicator of what happens in the run up to a heatstroke or a dehydration induced episode. This is further proof that the subtler symptoms like fatigue, poor sleep, and even brain fog should not be taken lightly."
— Prayat Shah, Head of Healthcare, Plum
Here’s a more detailed analysis of each biomarker:
- Concentrated urine; 1 in 3 summer patients, compared to 1 in 4 in winter: 32% of summer patients had abnormally concentrated urine, versus 26% in winter. That's a 25% higher rate, and it's the clearest, most direct signal of dehydration in the dataset. The trend shows up as early as March and peaks in April.
- Acidic urine; 1 in 4 summer patients, compared to 1 in 5 in winter: 24% of summer patients had abnormally acidic urine, versus 19% in winter, a 27% higher rate. Concentrated and acidic urine together are the kidney's two-pronged response to water loss, and both markers climb in parallel through the heatwave months.
- Low sodium; 1 in 10 summer patients, compared to 1 in 15 in winter: 10.5% of summer patients had low blood sodium, versus 6.6% in winter, a 59% higher rate. The counterintuitive bit: this isn't caused by sweating sodium out. It's caused by drinking too much plain water, which dilutes the sodium already in your blood. We'd recommend a sodium and electrolyte evaluation, plus supplementation for vulnerable groups like the elderly and children.
- Low magnesium; more than three times as common in summer: 5.1% of summer patients had low magnesium, versus 1.6% in winter. At a 214% higher rate, this is the largest relative jump of any biomarker in the analysis. Magnesium leaves the body through urine and sweat, and water alone won't put it back.
- High calcium; twice as common in summer: 0.74% of summer patients had elevated calcium, versus 0.37% in winter, double the rate. The absolute numbers are small, but the direction held up across every statistical method we ran. Elevated calcium during dehydration is linked to higher kidney stone risk in the heat.
- Low haemoglobin; 14% of summer patients, versus 12% in winter: low haemoglobin ran 18% higher in summer. This is the body expanding its blood volume to cool itself, which dilutes the concentration of red blood cells. It isn't a disease. It's a physiological response to heat that can leave you more fatigued and reduce your physical capacity through the summer months.
- Low hematocrit and low iron: low hematocrit, the companion measure to haemoglobin, was 13% more common in summer. Low iron was 17% more common. Both line up with the haemoglobin finding and point to iron as the upstream driver: iron is lost through sweat over weeks, which then chips away at the body's ability to maintain haemoglobin. Increased red blood cell turnover in the heat adds to the drop.
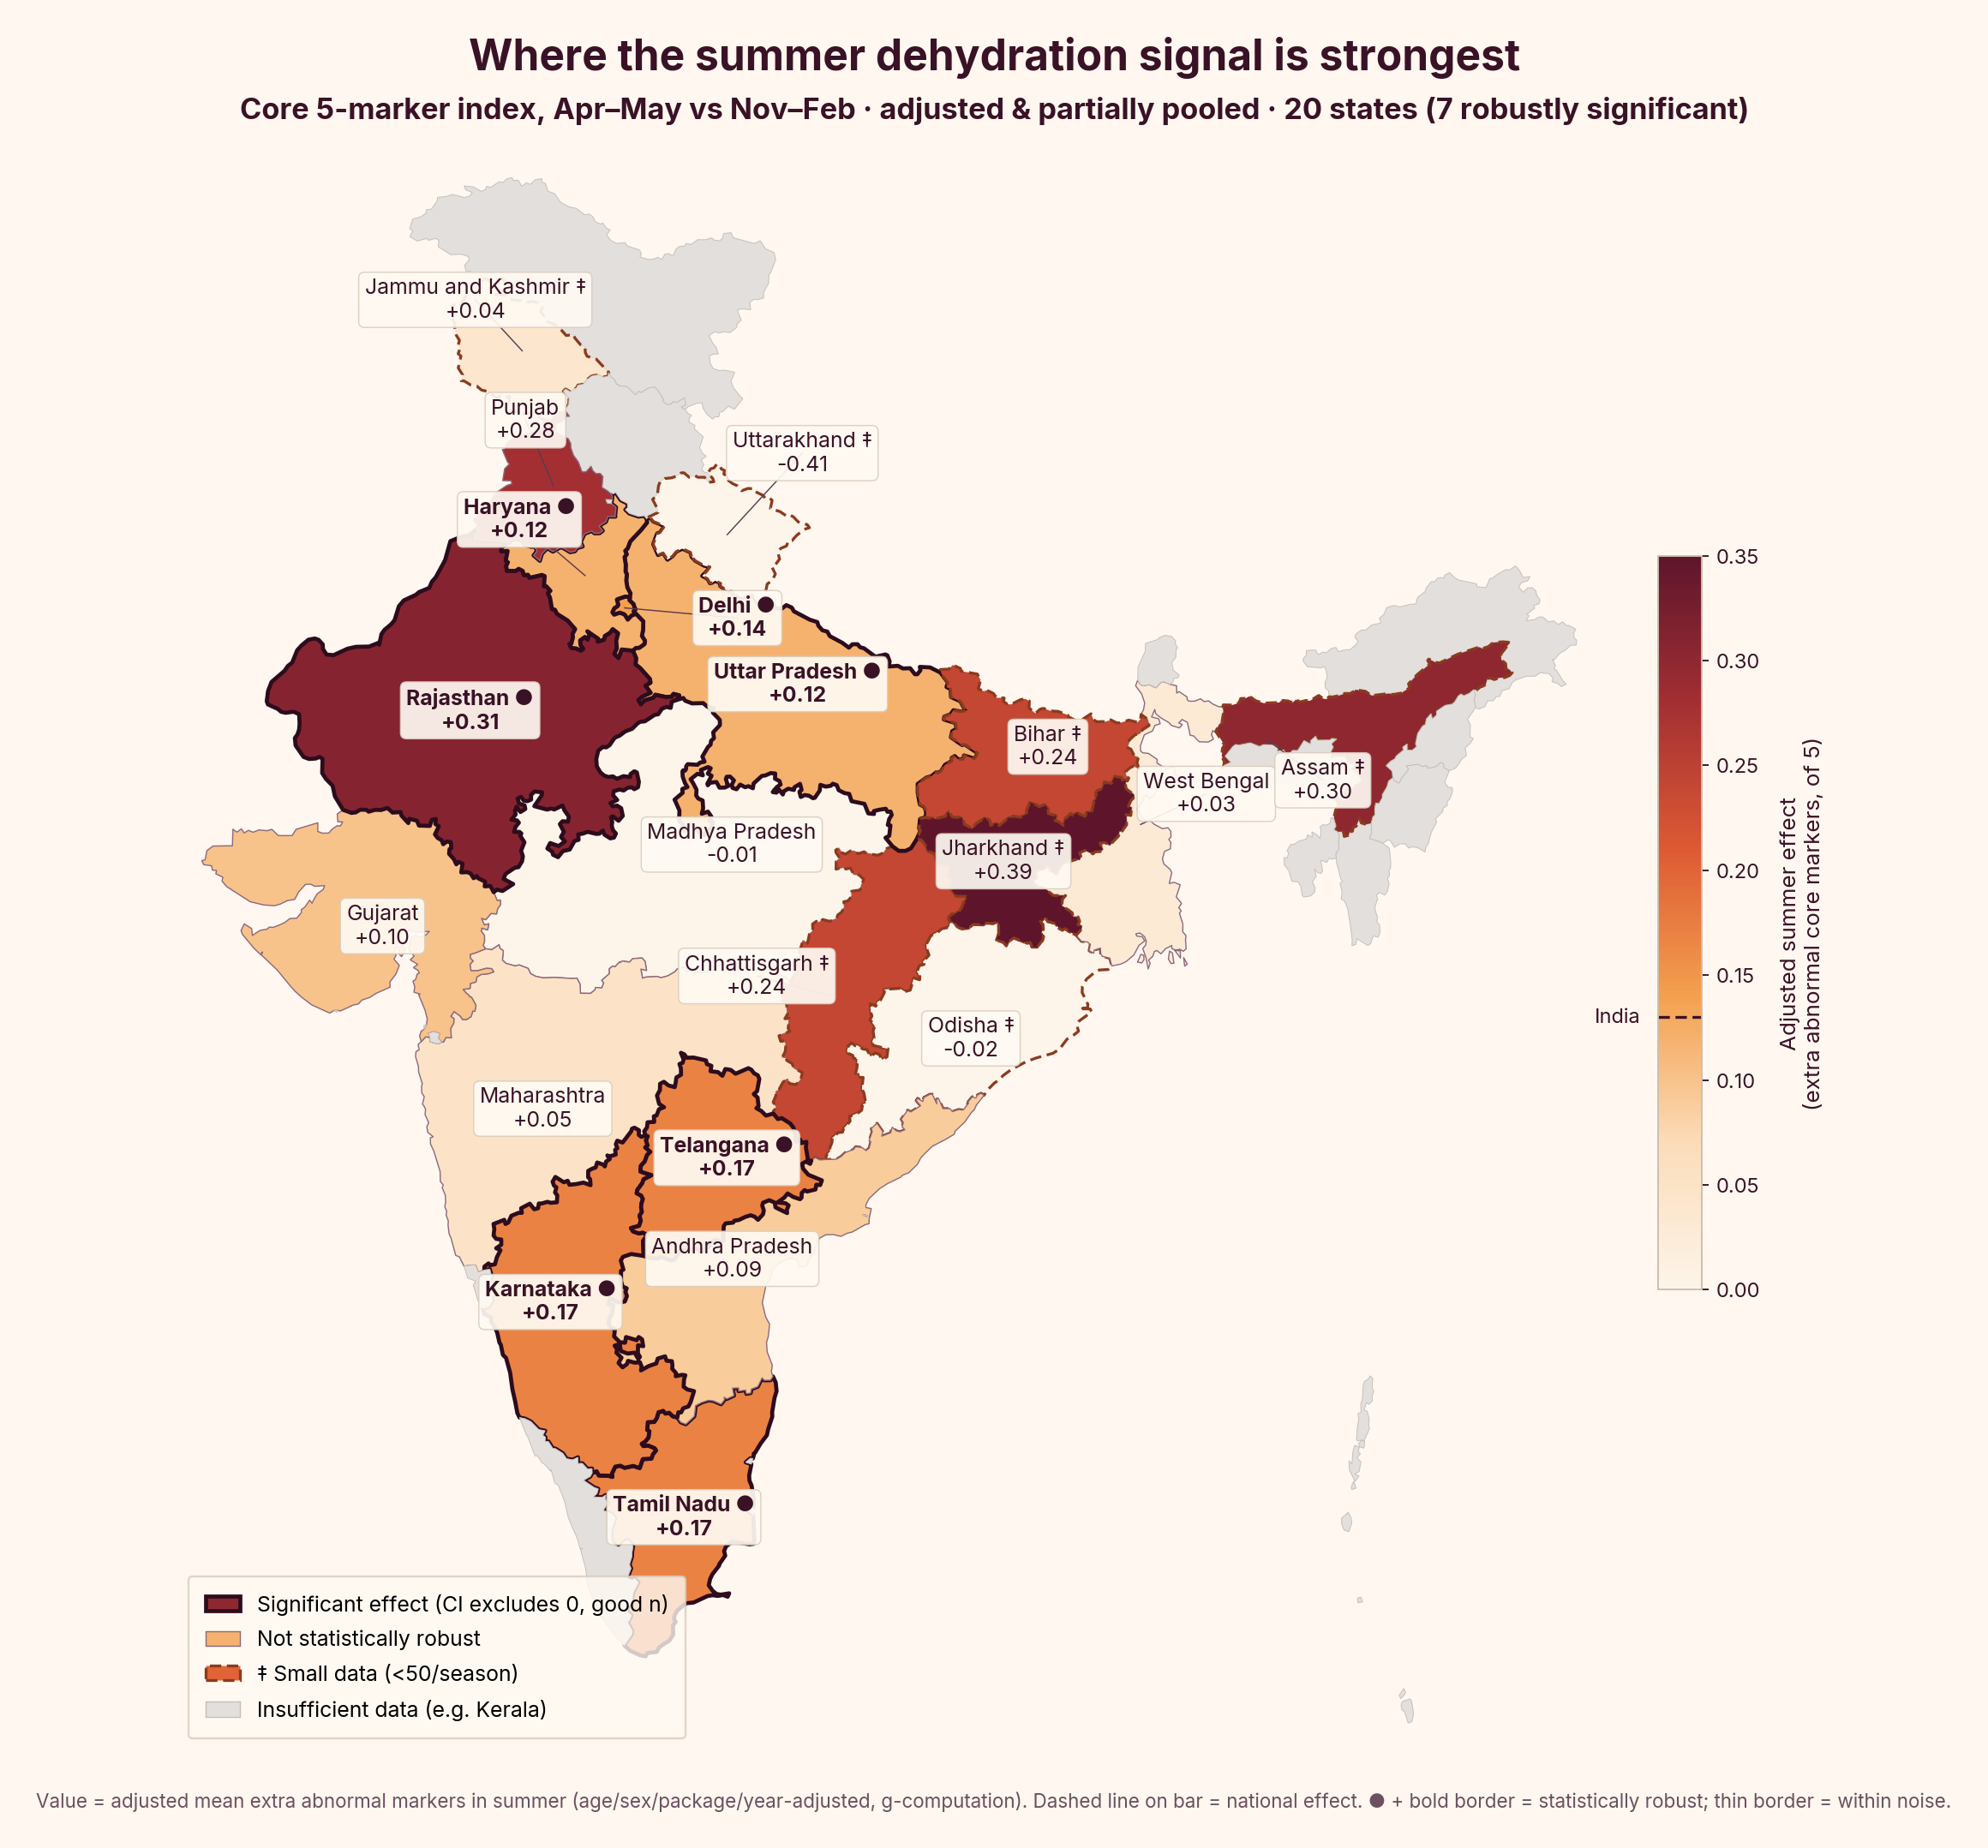
Dry, interior states are the most affected.
We also wanted to understand which states show the summer dehydration signal most clearly. To measure it, we built a single dehydration score for each patient by counting how many of five core warning signs were abnormal in their checkup — concentrated urine, acidic urine, high calcium, low haemoglobin, and low hematocrit. A patient with none flagged scores a 0; a patient with all five scores a 5. We then compared the average score of summer patients against winter patients in each state, after making the two groups fair to compare on age, gender, and checkup package. The number on each state and the colour, from pale cream to deep red, shows how many more of those five warning signs the average summer patient carries compared to the average winter patient.
This was a purely representational chart, with our caveats mentioned in the chart. That said, this points to a clear pattern: people living in India's hot, dry interior display the biggest delta in deranged biomarkers.
We shared these insights with Sailee Rane, Rainmatter’s Strategy Lead on Climate. She followed up with notes, asking us to check the impact of moist heat on biomarkers.
“Moist heat waves are more dangerous than dry heat waves because high humidity prevents sweat from evaporating, disabling the body's primary cooling mechanism. Rising core temperature puts greater strain on the cardiovascular system, and a heatstroke can set in within hours even when the thermometer reads moderate temperatures. Yet public awareness of this threat remains far lower than for dry heat, making communication of this research especially urgent.”
Our analysis reveals that coastal cities* witness a higher biomarker burden than the interiors**. This primarily shows up in blood markers, with the coastal city demographic showing greater abnormality in hemoglobin and hematocrit values. That said, while this supports the argument, this analysis does not quantify heat stroke risk by itself. We welcome expert commentary and feedback on this section.
*Coastal cities we have data for: Chennai metro, Kochi metro, Kolkata metro, Mangaluru, Mumbai metro, Nellore, Panaji, Puducherry, Surat, Thiruvananthapuram, Visakhapatnam
**Interior cities we have data for: Agra, Ahmedabad metro, Ajmer, Aurangabad, Bhopal, Chandigarh metro, Coimbatore, Delhi NCR, Gwalior, Hyderabad metro, Indore, Jabalpur, Jaipur, Jamshedpur, Jodhpur, Kanpur, Kota, Lucknow, Nagpur, Patna, Raipur, Udaipur, Vadodara, Varanasi
What you can do
We can’t control the weather – doing so would either imply access to technology that belongs in science fiction, or possession of enough soft power and charisma to get more countries to sign the Paris Accord, convincing those in power that climate change is a real threat. Alas, we don’t have that kind of pull yet.*
What to do in a heatstroke
What we can do, however, is offer you a quick to-do list on dealing with heat exhaustion. Most people will experience heat exhaustion at some point during a bad summer. Left unaddressed, it can escalate into heatstroke, which is a medical emergency.
Here’s a handy guide on what you can do.
How to avoid a heatstroke
You already know this, but here are some tips to help you with the heat.
- Hydrate before you're thirsty. Thirst is a late signal. By the time you feel it, you're already mildly dehydrated. Aim for water consistently through the day, not in one large go.
- Plain water has limits. If you're sweating heavily, outdoors, commuting, exercising, plain water replaces fluid but not electrolytes. A nimbu-paani with a pinch of salt, coconut water, or ORS once a day is enough for most people.
- Avoid the peak window. The 12pm–4pm window is when heat stress is highest. If you have to be outdoors, plan around it where possible.
- Dress for it. Loose, light-coloured cotton clothing significantly reduces heat load. This is not a style suggestion.
- Watch out for others. The elderly, children, and people who work outdoors are the most vulnerable. Only about 8% of India's population has access to air conditioning — most people are managing this heat with no buffer at all.
The biomarkers in this analysis like concentrated urine, low sodium, low magnesium don't announce themselves with dramatic symptoms.
Most people carrying these findings feel tired, foggy, and slow, and attribute it to the heat rather than to something measurable and correctable. A summer health checkup will tell you where you actually stand. If you haven't had one this season, this is the right time.
*That said, India is witnessing rapid growth in the climate change and carbon removal space, with a sharp rise in the number of companies entering the sector and making a sizable impact. Alt Carbon, for example, recently removed nearly 10,000 tonnes of CO₂ (9,566 verified tonnes) through its Darjeeling Revival Project.
Footnote: Supporting research
Each finding was cross-checked against peer-reviewed research. All eight biomarker signals have established scientific explanations.
Renal & Dehydration
- Urine Concentration (Specific Gravity) When the body loses water through sweat, the kidneys compensate by producing less, more concentrated urine. A specific gravity above 1.020 is the clinical marker for this. It is the most direct, real-time indicator of dehydration available in a routine blood and urine panel.
- Urine Acidity (pH < 5.5) Dehydration also makes urine more acidic. As the body loses fluids and struggles to maintain chemical balance, the kidneys excrete more acid — lowering urine pH. Acidic, concentrated urine together is a double signal of heat stress on the kidneys. [PMC — Heat stress, hydration and uric acid]
- Low Sodium (Hyponatraemia) Sodium is the primary salt that regulates fluid balance in the body. During heatwaves, many people drink large amounts of plain water to compensate for sweat loss — but this dilutes blood sodium rather than restoring it. This condition (heat-associated hyponatraemia) is a documented and underappreciated risk of heatwave exposure. [StatPearls, NCBI — Exercise-Associated Hyponatraemia] Sodium is not measured in all health checkup packages — it is absent from the Baseline Lite package, which accounts for a large share of records. Matching was done within the same package type to ensure summer and winter patients were being compared on equivalent tests.
Electrolytes & Minerals
- High Calcium (Hypercalcaemia) The kidneys regulate calcium alongside fluid balance. When dehydration concentrates the blood, calcium levels can rise. Sustained elevated calcium is associated with kidney stone risk — which increases sharply with heat and dehydration. This was the smallest absolute percentage in the dataset but showed the largest proportional rise. [Rangaraya Medical College — Heat Stress Nephropathy, South Asia 2024]
- Low Magnesium (Hypomagnesaemia) Magnesium is lost in sweat — roughly 10 to 15 milligrams per litre. Unlike sodium, it is not replaced by drinking water. Magnesium deficiency causes muscle cramps, fatigue, and irregular heartbeat, making it one of the most clinically important but least discussed heat-dehydration risks. [NCBI — Mineral Metabolism in Heat | Siquier-Coll et al., Journal of Thermal Biology, 2019] Note: Magnesium is only measured in three health checkup packages (Busy Professional, Disease Risk, Athlete), which together account for a small fraction of records. Matching was restricted within the same package type to avoid comparing patients who were never tested for magnesium against those who were.
Blood & Haematology
- Low Haemoglobin Haemoglobin carries oxygen in the blood. In summer, the body pulls extra fluid into the bloodstream as a cooling mechanism — expanding blood volume and diluting the concentration of red blood cells. This produces lower haemoglobin readings even in otherwise healthy people. It is not true anaemia — it is the body's own heat management system creating a temporary dilution effect. [NIH Bookshelf — Haematological Changes in Heat | PMC — Haematological Adaptations to Heat Acclimation, 2019]
- Low Hematocrit Hematocrit measures what fraction of the blood is made up of red blood cells. It tells the same story as haemoglobin — heat-driven fluid expansion into the bloodstream dilutes red cells, lowering the hematocrit reading.
- Low Iron Iron is lost through sweat and is required to produce haemoglobin. Iron deficiency is the underlying driver of the haemoglobin and hematocrit changes described above. It is not an immediate heat response — it builds gradually over weeks of summer exposure. Its presence in the data, alongside the haemoglobin findings, suggests the dehydration effects in this dataset are not just acute but cumulative. [NCBI Bookshelf — Iron and Mineral Loss in Sweat] Note: Iron is absent from the Baseline Lite package. Matching was restricted to the same package type.