













The Wall at Fudai
In the 1970s, Kotaku Wamura, mayor of Fudai, a fishing village in northern Japan, refused the prefecture's proposal of building a ten-metre sea wall. He had seen what the 1933 tsunami did to the coast, and insisted on increasing the height to 15.5 metres. Despite being accused of wasting public money, he pushed it through anyway. He died in 1997.
On March 11, 2011, the Tōhoku tsunami wrecked the coasts of Japan. The villages around Fudai, whose walls had been built exactly to ten metres, lost around two hundred people. Fudai was left standing, and people walked up the hill to Wamura's grave to pay their respects.
Many times, employee health benefits budgets contain line items that feel like too much until the year the investment pays off. This is often referred to as the Prevention Paradox: the peak of a successful preventative health program looks like nothing happening at all.
For four years this report was the State of Employee Benefits — a description of how things are. A description will not tell you whether your wall is high enough.
This year it is the Standard.
Companies have improved the quality of benefits.
Four years of tectonic shift, visible on one matrix.
The last four years have seen a tectonic shift in employee health. This has been influenced by multiple developments happening at the same time. First, medical inflation continues to grow at double digits, impacting out-of-pocket expenditure. Second, the early onset of chronic conditions has become more pronounced in the country, manifesting almost a decade earlier. Third, more companies are treating health benefits as long-term investments, accelerating a mindset shift from treating benefits as reactive, checklist items to proactive interventions that drive great health outcomes for employees.


Insurance
- Companies offering sum insured > ₹5,00,000 have increased 53%.
- Companies offering a maternity limit > ₹75,000 have increased 155%.
- Companies adding term life and personal accident have increased 179%.
Primary and preventive health
- Average number of health benefits offered in addition to insurance has risen from 1 to 3.
- Share of organisations offering healthcare benefits has grown 2.2×. Telehealth rose 2.1×, health checkups 5×, and mental health, OPD and dental/vision 5.5×.
| Top quartile 2023–24 | Median organisation 2025–26 |
|---|---|
| ₹5,00,000 sum insured | ₹5,00,000 sum insured |
| Family floater with parents (ESCP) | ESC family cover; voluntary parents |
| Maternity cover at ₹75,000 | Maternity cover at ₹50,000 |
| GPA only | GPA and GTL together |
| Telehealth · mental health | Telehealth · mental health · health checkups |
| Healthcare ~1% of total benefits spend | Healthcare ~3% of total benefits spend |
| ~2 healthcare benefits in the stack | ~3 healthcare benefits in the stack |
The pace of innovation in this space has been so rapid that a top-quartile benefits plan in 2023–24 is barely the median today.
Three India Incs
Funded startups, local Indian businesses, and MNCs & GCCs — three employers, three speeds.
The labour force in India is defined by three groups of employers — funded Indian startups, bootstrapped and local Indian businesses, and international MNCs and GCCs.
Funded startups are the disruptors. They compete for the same talent as MNCs, GCCs and peer startups — so top-tier hires hold them to a higher bar, and capital plus market instinct keep them innovating. Local Indian businesses drive insurance penetration in the country. Employing a large share of India's workforce, their benefits are often the family's only line of defence against a health emergency. MNCs and GCCs bring global standards to India, and local players attempting to match and beat these standards accelerate disruption across the market.


Funded startups
- Funded startups get comprehensive benefits early to attract top talent, optimise as they scale headcount post-PMF, then match global companies after a late-stage (Series C+) raise.
- A fundraise lifts median benefits spend per employee about 35% — 8–15 percentage points above matched non-raisers. Common upgrades include parental coverage, term life cover, deeper maternity, and healthcare benefits.
- Funded startups are using healthcare benefits to compete against their global peers, with a mere 5–8% increase in premiums.
Local Indian businesses
- Local Indian businesses are still improving insurance coverage before investing in preventive and holistic health.
- Financial services offer the best benefits in this cohort, with a 1.4× higher investment in benefits compared to the median.
- Employee health is the highest-ROI talent attraction and retention strategy for these companies as they compete for talent against funded and global peers with better payroll and employer brands.
International companies
- International companies offer the best benefits in the country, beating even Indian unicorns and incumbent enterprises. Median spend per employee runs about 1.6× a funded startup and nearly 3× a local Indian business, and 43% sit as Holistic Leaders.
- Benefits strategy is influenced by why companies are setting up in India. Tech and product outposts offer great benefits. Service-arbitrage orgs don't offer the same quality of benefits as the former, but still beat local competitors.
- Top-decile Indian health benefits plans aren't just cost-effective; they are also among the most comprehensive in the world.
- More international orgs are moving out of global mandates to work with local partners with deep benchmarking and tech expertise — a 150% increase in these conversations over three years.
From health benefits to health outcomes
Benchmarks improve standards; adoption and utilisation decide whether a stack is truly beneficial.
While benchmarks improve standards and the quality of benefits, adoption and utilisation trends drive real outcomes and determine if a benefits stack is truly beneficial.
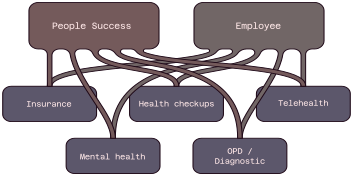
The old way · A Vendor Maze
The New Standard · One Healthcare Platform
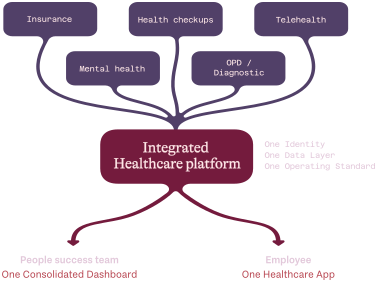


One integrated platform
- The unification of employee health improves experience, adoption, and compliance. Companies today prefer unified platforms over vendor mazes.
Claims trends
- 5% of employees use up 88% of total claims spend.
- Chronic claims make up about 34% of claimed net spend, and chronic claim spend amongst working Indians is growing at 22% over two years.
- Chronic risk manifests years before a hospitalisation. Early detection and intervention are essential. 57% of Indian employees discover serious conditions only in emergencies, at 3× the cost of earlier detection.
Healthcare
- Preventive and primary health is improving access and outcomes. 74% of mental-health users and 61% of health-checkup users are accessing the benefit for the first time in their lives. Access extends to dependants too — they account for 37% of doctor consults and 24% of OPD claims.
- Multiple health benefits drive health loops: 70% of repeat health-checkup users on Plum witnessed a clinically significant improvement in deranged biomarkers.
- Companies investing in health benefits have a 13% lower chronic claim incidence, translating to savings of up to ₹480 per employee during renewal.
Companies are emerging as catalysts for great health outcomes.

Years Where
Decades Happen
Le Grand K
For a hundred and thirty years the kilogram was defined by a lump of platinum-iridium, kept under three nested glass bell jars in a vault outside Paris. Official copies went out to the countries who needed a reference, and every few decades they were all brought back and weighed against each other.
Over time, the original lump and its many copies stopped agreeing. By the 1980s the original and its copies had drifted apart by roughly the weight of a grain of sand, and nobody could say which had moved.
A standard defined by a single object has this problem: it can never be verified, but only agreed on. In 2019 the kilogram was redefined against a constant of nature and the lump was retired to a museum.
Employee benefits in India are measured by the older way. Every company has its own cylinder and checks it against nothing in particular — which is why nobody knows if they're a market leader or the median, or if their utilisation is good or bad.
Founder's Note
At  , we strongly believe companies will materially improve both health coverage and health outcomes for Indians over the next decade.
The first vector is insurance.
Five years ago, health insurance penetration in India was low. Despite everything that has followed — a pandemic, regulatory push, and rapid growth in group cover — it remains low. IRDAI data for FY25 estimates the total health-insured lives at about 58 crore, or under 40% of the population. Health insurance premiums account for just 0.36% of India's GDP — roughly one-fifteenth the US share, and well below peers such as South Korea (~0.7%) and Australia (~1%). Real progress in insurance needs both: more lives covered, and deeper investment as a share of GDP. We believe employers will play the most important role. Group health lives are already growing at a 23% CAGR and companies are improving the quality of coverage, making it both more progressive and comprehensive. Across countries with employer-anchored systems like the US and South Korea, employers have been the primary drivers of private coverage. The same is attainable here, and it is on us to empower companies and decision-makers to write India's healthcare story.
The second vector is healthcare.
On a parallel track, companies are beginning to shape health outcomes, not only coverage, taking a participatory role in preventive and primary care. That shift will accelerate as the new labour codes and government regulations take effect. Our data reveals that these investments help employees save more than ₹10,000 a year in out-of-pocket healthcare spend. They also influence the first decisions people make about their health — often the first company-sponsored health check-up, the first gym subscription, the first structured preventive intervention.
And they're improving health outcomes: preventive health checkups have improved early detection of chronic disease ~1.5×; about 70% of repeat checkup users improve biomarkers by a clinically significant value; and companies with healthcare see ~13% lower chronic incidence among employees. Employers have emerged as catalysts of better health outcomes for Indians, improving access and quality of care.
We see health as the product of both these vectors.
Companies are beginning to see insurance and healthcare not as separate line items, but as complementary pieces of the same puzzle. When unified with emerging technology, these benefits accelerate the shift in the country's relationship with health — from reactive to proactive and holistic.
We're in the business of health. Over the last seven years, we've had the privilege of working with the fastest-growing startups, legacy Indian organisations, and global MNCs setting up in the country. We don't take this lightly, and have spent hours and days with people leaders to help them craft great policies. This report is our commentary on the state of employee health and how it has evolved over the last few years — drawing on observations across over 15,000 benefit plans.
When companies make thoughtful investments in their team's health, they act as a force multiplier for crores of Indians. Everything else — productivity, retention, and savings — will follow.
How India Inc's benefit stack has changed over the last five years
From compliance-item insurance to holistic programmes — 15,000+ companies mapped on one matrix.
Five years ago, the traditional employer benefits plan was health insurance. This was often treated as a compliance item, and close to 43% of companies were content with just offering a basic health insurance cover.
That mindset has changed over time. Today, a majority treat health insurance as an important investment, moving from basic plans to more comprehensive ones with higher sums insured, broader family coverage, maternity benefits and more. We also observe significant movement in the healthcare axis too, with a nearly fivefold increase in companies crafting holistic healthcare programmes that extend beyond insurance.
To quantify this shift, we mapped 15,000+ companies on our health benefits matrix. The matrix evaluates employer health benefits on two axes: insurance depth (completeness of the insurance coverage — sum insured, family definition, maternity, and related design) and healthcare breadth (how far the programme extends beyond insurance into preventive and primary care). Each employer is placed into one of four quadrants.
Starters keep the plan focused and durable: a clear GMC core that covers the essentials without over-engineering the stack. Insurance-Strong employers have built deep protection — high sum insured, family coverage, maternity — making insurance the centrepiece of their talent offer. Wellness-Forward employers invest early in healthcare breadth, putting prevention and primary care in employees' hands even as the insurance layer continues to mature. Holistic Leaders combine both strengths — comprehensive insurance with a real healthcare layer — and sit in the top-right of the matrix.
The average Indian company has been shifting to the top right side of the health benefits matrix, and we only see this trend accelerating.
Companies have started investing more in health benefits, and that is not driven by inflation alone
Median investment up at a 14.7% CAGR over three years.
The median investment in health benefits by companies has grown at a CAGR of 14.7% over the last three years. While this is influenced by healthcare inflation, this is also due to enhancements in the quality and coverage of health benefits offered.
"Our philosophy transcends traditional benefits programs. We understand that in today's fast-paced world, true success is fuelled by a holistic approach to health — encompassing physical, mental, and emotional dimensions."
— Mudita Chauhan, Chief Human Resource Officer, CoinDCX
Insurance coverage has become deeper
Richer cover is being adopted faster. Since FY22, sum insured above ₹5L is up 53%; maternity above ₹75k is up 155%; and accident and/or life cover is up 179%.
Healthcare access has become broader
Since FY23, median benefits per organisation rose from 1 to 3; healthcare's share of total health benefits spend climbed from <2% to 6.1%; and among adopters, median healthcare spend per employee more than doubled.
2023–24's top quartile is the median organisation today.
| Top quartile 2023–24 | Median organisation 2025–26 |
|---|---|
| ₹5,00,000 sum insured | ₹5,00,000 sum insured |
| ESCP, with parents/in-laws covered | ESCP family cover; only parents |
| Maternity cover at ₹75,000 | Maternity cover at ₹50,000 |
| GPA | GPA and GTL both |
| Telehealth · Mental health | Telehealth · Mental health · Health checkups |
| Healthcare ~1% of total health benefits spend | Healthcare ~3% of total health benefits spend |
| ~2 healthcare benefits in the stack | ~3 healthcare benefits in the stack |
The 2% club isn't aspirational anymore. It is the standard
About 2% of payroll into employee health — now common practice across leading cohorts.
Two years ago we compared health-benefits investment as a share of total employee budgets. Developed markets such as the US, France and Singapore spend close to 10%. Indian organisations sat closer to 1.3–1.6%.
That 2% mark used to be aspirational in 2024. Today it is more common. GPTW-certified employers, LinkedIn Top Startups, Fortune 500 India units and Forbes Emerging Tech companies routinely put about 2% of payroll into employee health benefits.
Health benefits at ~2% of employee budgets is becoming common practice, and the stack is mostly similar across cohorts.
| Benefits | Funded Startups | Indian Organisations | MNCs & GCCs |
|---|---|---|---|
| Core Insurance | |||
| Median sum insured | ₹15,00,000 | ₹10,00,000 | ₹30,00,000 |
| Dependents & coverage | ESCP (parents/in-laws) | ESCP | ESCP (parents/in-laws) |
| Mother & child | Maternity cover at ₹1,50,000 | Maternity cover at ₹1,00,000 | Maternity cover at ₹1,50,000 |
| Personal accident | GPA cover of ₹40,00,000 | GPA cover of ₹35,00,000 | GPA cover of ₹50,00,000 |
| Term life | GTL cover of 4× CTC | GTL cover of 2× CTC | GTL cover of 4× CTC |
| Progressive benefits | IVF cover; Autism, Surrogacy; Critical Illness; Modern Treatments at 100% SI | IVF cover; AYUSH; Modern Treatments at 50% SI | IVF cover; Autism, Surrogacy; Miscarriage; Critical Illness; Modern Treatments at 100% SI |
| Healthcare | |||
| OPD / health wallets | ₹10,000 OPD cover | Uncommon | ₹25,000 OPD cover |
| Telehealth | General Physician and Specialists | General Physician and Specialists | General Physician and Specialists |
| Health checkups | At home plan covering up to 100 biomarkers | At home plan covering up to 85 biomarkers | At home plan covering up to 150 biomarkers |
| Mental health | IPD covered with sublimit; Access to therapists | Access to therapists | IPD covered upto full SI; Access to therapists |
| Vision/Dental | Covered | Uncommon | Covered |
| Diagnostics / vaccinations | Uncommon | Uncommon | Covered |

What shifting 2% of fixed employee costs to health benefits can get you today
Moving your health benefits budget by 1pp is the highest ROI benefit you could offer your team. Here's a simple guide on how you could allocate your budgets to offer an exponentially better plan, while not impacting employee satisfaction.
| Budget line | Nature | Typical (per ₹100) | At ~2% health |
|---|---|---|---|
| Cash compensation (basic, HRA, allowances, variable) | Mostly fixed | ~85 | ~84.5 |
| Statutory retiral & social security (employer EPF, gratuity, ESI/EDLI) | Non-discretionary | ~8 | ~8 |
| Group insurance (GMC, GPA, GTL) | Discretionary · high NPS | ~0.8 | ~1.5 |
| Healthcare / wellness | Discretionary · high NPS | ~0.2 | ~0.5 |
| Discretionary perks | |||
| R&R, offsites, celebration & event budgets | Reallocatable · low NPS if trimmed | ~1.5 | ~1.2 |
| Lifestyle stipends (gym, clubs, gadgets, culture apps) | Reallocatable · low NPS if trimmed | ~1.0 | ~0.8 |
| Commute / cab top-ups beyond hybrid need | Optimize · medium NPS | ~1.0 | ~1.0 |
| Meals & pantry (core daily food) | Protect · high NPS in India offices | ~1.5 | ~1.5 |
| Learning & development / upskilling | Protect · high career NPS | ~1.0 | ~1.0 |
| Health benefits total | ~1.0 | ~2.0 | |
Where a pullback hits NPS hardest
| If you pull this back | Likely NPS / trust hit | Why | Use to fund the 2% shift? |
|---|---|---|---|
| Core meals / daily food security; L&D that careers depend on | High | Daily lived experience (meals) and mobility (learning). Visible, frequent, hard to explain away. | No — protect |
| Commute / cab policies in hybrid setups | Medium | Frustration is real but redesign (cap, WFH days, shared cabs) often lands better than a blunt cut. | Optimize, don't raid |
| R&R / offsites / celebration budgets; lifestyle stipends | Low–medium | Episodic or unevenly used. Glassdoor-style benefit research consistently ranks lifestyle perks below health, leave and retirement for overall satisfaction. | Yes — first 0.5 points |
What that 2% unlocks. Family cover with parents, progressive maternity benefits, accident cover, and at least one additional primary-care benefit.
Where the rupee comes from. −0.3 from R&R/events and −0.2 from lifestyle stipends, plus −0.5 from variable/flex cash during yearly hikes fund +1.0 into health. Shared-funding (parental co-pay, flex wallets) can increase depth of coverage.

The Benefits Stack of
The Three India Incs
Neurath's Boat
The philosopher Otto Neurath had a standing answer for people who wanted to tear a system down and rebuild it properly.
We are sailors, he said, on the open sea. The ship can be repaired plank by plank, with whatever timber can be brought aboard, and improved considerably that way over time.
What cannot happen is putting into dry dock and starting again from the keel. There is no dock. There has never been a dock. Everything that is ever going to be done to this ship gets done while it is carrying you.
There ain't no rest for startups, and no company in this cohort gets to stop and rebuild. The benefits policy they have is the policy they need to improve, and it has to keep working through every hire, every renewal, and every round.
A funding event adds roughly 35% to spend per employee, and what it reliably buys is more of the ship rather than a different ship.

Funded Startups in India
Benefits are how this cohort hires and retains — not a compliance line.
When we say funded startups, we mean venture-backed Indian companies — from pre-seed teams testing product–market fit to Series C+ enterprises competing with FAANG, MBB firms, and Indian unicorns for talent. Decision-makers shift as they grow; the through-line does not: benefits are how they hire and retain, not a compliance line.
The tone for this cohort is set outside the benefits stack. Zinnov–NASSCOM's recent reads of India's tech landscape describe an ecosystem that has moved from exuberance into strategic resilience: funding recovering, new company formation accelerating again, DeepTech and AI absorbing a rising share of capital, and unicorn formation still among the world's densest. In parallel, Zinnov's GCC work frames India as a global capability capital — millions of professionals, hundreds of AI centres of excellence, and a talent market where global employers and domestic startups now bid for the same people. Funded startups sit in the middle of that contest: they are not the largest employers by headcount, but they are among the loudest employers by culture, pace, and expectation.
Growth, for this cohort, is not abstract. A raise compresses years of organisational change into months — new functions, new cities, new seniority mixes, and a sudden need to look credible to talent that can choose a GCC, a unicorn, or a Series A peer. That velocity is why funded companies have rewritten parts of the Indian employment bargain. Remote-first and hybrid norms normalised faster here than in much of traditional India Inc. Titles flattened; feedback loops tightened; equity and learning became part of the offer conversation. Health benefits followed the same arc: what used to be a compliance GMC is increasingly read as a signal of how seriously a company takes the person behind the laptop.
They are also disrupting habits that used to sit outside the employer's remit. Preventive checkups, tele-consults, mental health access, parental inclusion, and progressive cover design are no longer "nice-to-haves" reserved for MNC handbooks. Founders who grew up in FAANG or late-stage product companies imported that expectation into seed and Series A rooms — and candidates noticed. In a market where analysts and commentators point at talent scarcity in AI, product, and specialised engineering, the companies that treat health as part of the product of work pull ahead of those that treat it as a line item to optimise.
This chapter follows that story through the growth curve: how early teams buy deep, how scaling teams trade off under unit-economics pressure, how mature funded enterprises rebuild to compete with global employers — and where a raise still resets the plan.
Startups begin ambitiously, optimise as they grow, and build a comprehensive benefits stack once they mature.
Stage-based strategy
A funded company's benefits strategy is influenced by where it is in the growth curve. Early founders buy deep. Scaling teams trade breadth for cost as economics of hyper-scale catch up. Mature enterprises rebuild once they are competing for the same talent as global leaders and Indian unicorns.
| Early | Scaling | Mature | |
|---|---|---|---|
| Profile | Pre-seed and seed; typically 0–50 employees. Decision maker is a founder — often an executive at a previous organisation. Testing PMF; hiring aggressively from established companies. | Series A–B; typically 51–300 employees. Hit or close to PMF; scaling across functions; optimising budgets with scale; rising admin and ops burden. | Series C+; typically 300+ employees. Established org hierarchy; competing with FAANG / MBB / Indian unicorns for talent; security is a priority. |
| Approach to benefits | Founders have a greater appetite for a deep health benefits plan. ~77% of companies in this stage are already on the right side of the matrix — deep insurance or Holistic Leaders. First-time insurance buyers in this band always invest in atleast one healthcare product alongside insurance. |
Investment rises, but trade-offs sharpen as scale economics catch up. Healthcare breadth thins — a median of ~2 healthcare benefits vs ~3 at seed. Limits and copays appear; cost-sharing with employees becomes more common. |
Appetite and means to compete with FAANG for talent. People leaders benchmark against the top percentile of employers worldwide. Country's most inclusive / progressive healthcare benefits show up here — infertility, critical illness, OPD wallets, and more. Sharp growth in OPD covers, flexible benefits plans, and related design. |
| Key decision maker | Founder | Head of People Success · Head of Finance | Head of Comp & Ben · CHRO · CFO |
| Requirement | Tech-led solution — fast to stand up, low ops overhead. | Tech-led solution with HR-ops automation, HRIS / payroll integrations, and clearer renewal controls. | Tech-led solution plus reporting, peer and global benchmarks, DEI benefits, finance visibility, data privacy and security, bespoke care / preventive programmes, and flexible benefits. |
| Median benefits stack | Insurance: GMC ₹5,00,000 – ₹7,00,000 · ESC · Maternity ₹50,000 · GPA Healthcare: Telehealth · Annual health checkups Founder-deep — healthcare clears the median |
Insurance: GMC ₹5,00,000 – ₹7,50,000 · ESCP · Maternity ₹50,000 · GPA Healthcare: Telehealth Scale trim — breadth gives way to cost control |
Insurance: GMC ₹5,00,000 – ₹7,50,000 · ESCP · Maternity ₹75,000 · GPA and GTL Healthcare: Telehealth common · Health checkups Rebuild starts on insurance depth |
| Top-of-book (P95) benefits stack | Insurance: GMC ₹10,00,000 · ESCP · Maternity ₹1,00,000 · GPA · GTL emerging Healthcare: Telehealth · Health checkups · Mental health · Vision / dental Seed teams that buy like Series C |
Insurance: GMC ₹10,00,000 · ESCP · Maternity ₹1,00,000 · GPA · GTL Healthcare: Telehealth · Health checkups · Denser primary layer Scale leaders keep breadth while peers trim |
Insurance: GMC ₹10,00,000+ · ESCP · Maternity ₹1,00,000 · GPA · GTL Healthcare: Telehealth · OPD / wallets · Mental health · Progressive covers (infertility, CI pathways) Competing with global employers on inclusion |
Overview & Benchmarks
The median stack by stage — and the top of the book.
The previous section showcased different cohorts by appetite to invest, benefits stacks, and priorities. This section covers detailed benchmarks across common health benefits.
Ambition first, then optimisation, then a rebuild.
How a funding event influences benefits spend
A raise adds ~35% to spend per employee within one renewal cycle.
Funding events result in a 35% median increase in per-employee spend on health benefits, an 8–15 pp increase from peers.
After its latest equity round, a funded startup's median benefits spend per employee rises 35% within one renewal cycle. Matched funded non-raisers in the same employee band drift up 12–20% over the same window. Both size of round and stage of round play a role, with large Series C+ rounds seeing the best upgrades.
“We’ll fix benefits after the next round”
Benefits are rarely top of mind for employers — especially early. Capital is spent on the immediate needs of the business. At pre-seed and seed, that usually means hiring for capacity and bringing in senior people who can shape the product. The health plan, if it exists, is often a founder's imported default rather than a designed people strategy.
At Series A, the company finally has a sizable team and enough funds to negotiate properly — or even to consider a fuller spectrum that includes life cover, accident cover, and a real healthcare layer. That is when benefits show up on the agenda as something you can afford to get right.
Series B is where tradeoffs happen. The company has typically revised benefits in the last round — often only 18 months to two years earlier — so the topic does not return as a priority. Founders and finance are deep in unit economics, expansion, and the next term sheet. The organisation tells itself it can wait for the next round for aggressive improvements.
By Series C the company is big enough to care about employer brand against global peers. With brand comes employee benefits: progressive covers, parental inclusion, OPD, mental health, and the kind of stack that holds up well against FAANG and late-stage peers.
However, candidates do not care whether you are Series A, B, or C. They care whether the offer covers their parents, whether maternity is serious, whether they can see a doctor without friction, and whether the company treats health as part of the deal. This talent is already comparing offers against larger Series C companies or an exciting early stage startup that has just raised a Series A.
A funding round acts as a catalyst towards improving the quality of benefits
What benefits do companies upgrade after a successful fundraise?
| Benefit | Median MNC/GCC | Impact on premium |
|---|---|---|
| Parental coverage | 100% of companies that did not cover parents invested in an ESCP plan | High |
| Term life and personal accident coverage | 82% of companies invested in term life and accident cover | Medium |
| Improved maternity benefits | 55% of companies either added a maternity benefit, or increased the cover to >1L | High |
| Healthcare breadth | 100% of companies added at least one healthcare benefit to their stack — telehealth, health checkups etc. | Low |
Catching up with international players
Insurance first, then breadth — the open ground is the preventive and primary layer.
The median funded startup was already on the right side of the matrix — deep insurance as the default — and is moving into the top quadrant as healthcare lands on that stack. The gap with MNCs/GCCs continues to widen; what separates the cohorts is less the GMC than the healthcare layer beside it.
Insurance-Strong remains largest; Holistic Leader roughly triples. The funded arc is insurance first, then breadth. Catching international peers rarely turns on another lakh of SI — the open ground is the preventive and primary layer.
Funded startups have always known the importance of investing in deep insurance. This mindset has helped them transition into Holistic Leaders over the last three years.
How a median funded startup becomes a Holistic Leader
Today, the median funded startup can close most of the gap with improved healthcare breadth. Health insurance is already comprehensive — around ₹5,00,000 sum insured, parental coverage, maternity limit of ₹75,000, accident and term life cover. What changes is everyday care: virtual healthcare, annual checkups, mental health, dental and vision, an OPD wallet, and minor improvements to health insurance coverage.
Becoming Holistic is mostly a healthcare-breadth problem. From a funded Insurance-Strong median, intentional investments in healthcare influence the company's trajectory on the matrix. Enhancements to insurance cover, like maternity to ₹1,00,000, a GMC top-up, and critical illness close the remaining stretch, with only a mild impact on premium.
The new standard of employee health benefits will be set by this cohort.
Why it happens here first
Funded startups know this talent market better than almost anyone else hiring in India. They also have more room to spend than most Indian companies. So if benefits design gets disrupted, it usually happens here first.
Innovation among these companies is also a response to employees who treat the health plan as part of the offer, and notice quickly when competitors offer a more comprehensive plan. Checkups, specialty care, and flexibility are already in hiring conversation — and founders have to keep experimenting because of it.
The last big rewrite of Indian employee benefits came from employers like Flipkart willing to go above and beyond for the health of their teams. Funded startups are in that position now. The bar they set over the next few years for innovation will be the one the rest of the market has to clear.
Birbal's line
One day, Emperor Akbar drew a line on the floor of the court and challenged his ministers to make it shorter — without touching it.
His trusted council approached the problem with knives, with cloth to rub it away, with philosophical arguments about optical illusion. All suggestions either touched the line or missed the point entirely.
Birbal walked up, drew a second, longer line right beside the first, and sat back down. And just like that, the emperor's line was now the shorter one. There had been no need to touch it.
Local Indian businesses are finding it harder to compete against their funded and international peers. The latter's payroll line is not getting shorter — nobody's negotiating that down, and trying is attention spent on the wrong problem.
However, this group draw is the second line: a benefits plan good enough that the comparison stops being about cash CTC at all.

Local Indian Businesses
These businesses play the scale game.
This cohort constitutes employers that are neither venture-backed nor multinational captives — from small professional services shops and regional manufacturers to established NBFCs, IT services firms, retail chains, schools, hospitals, and hospitality groups.
These companies absorb a large share of India's formal and semi-formal workforce. Where funded startups rewrite the employment bargain for a scarce product-and-engineering talent pool, bootstrapped Indian businesses set the everyday standard for millions of Indians whose families still depend on their company's policy as the first real health cover they have ever held.
While global employers and funded startups bid aggressively for specialised talent, this broader Indian employer base is served by bootstrapped businesses. Their hiring is steadier and more local; their budgets are tighter; their benefits decisions are filtered through unit economics, cash flow, and industry norms rather than a fresh term sheet. They are also navigating a vociferous disruption of Indian work habits. Employees who once accepted employee-only cover now ask about extended family cover. Maternity is no longer a rare add-on in professional services. Telehealth and annual checkups have moved from “fancy startup perks” into hiring conversations.
The priority for this cohort is not whether health benefits matter. It is how they can use them as a competitive advantage against their funded peers in an environment where it is impossible to compete on payroll and employer brand.
Bootstrapped Indian businesses employ at national scale — and their benefits decisions set the floor for a large share of working India.
While Funded Startups and International companies have improved their benefits, local Indian companies are still catching up.
Benefits upgrades happen through three stages.

- Stage One: To the right, where companies level up on insurance.
- Stage Two: To the top, where companies invest in healthcare on a solid insurance foundation.
- Stage Three: To the top-right, where companies enhance both axes and join the top quartile as Holistic Leaders.
Stages are usually sequential: Insurance is the first priority; healthcare investments become commonplace once insurance is in place.
Most bootstrapped companies today are still in Stage One, while funded and international companies are in Stages Two and Three.
The median bootstrapped company today is still making a move to the right — clearing insurance maturity. On the other hand, funded startups and international companies are already layering healthcare on a deeper insurance stack.
A local Indian company's investment in health benefits is almost half that of a median startup and about a third that of a median international company.
The quality of benefits offered by Indian businesses is defined by the industry they operate in.
Industry sets the ceiling on what a bootstrapped plan can carry — who you hire, who your clients are, and how tightly unit economics constrain renewals.
| Industry | Profile | Approach to benefits | Requirement | Median benefits stack (≥50% adoption) | Top-level benefits stack |
|---|---|---|---|---|---|
| Financial Services | Banking, credit, payments, securities, asset / wealth management, regulated intermediation. NBFCs, brokers, advisors, fintechs with a financial product. | · Deep GMC and family first · healthcare still lags the insurance floor · Competitive for mid/senior talent that can leave for banks, GCCs, or funded fintech | · CFO-ready benchmarks · Telehealth + checkups once ESC + maternity clear. | Insurance · ESC · Maternity Healthcare · Telehealth Family depth leads; everyday care lags |
Insurance · GMC (ESCP) · Maternity · Parents · GPA Healthcare · Telehealth · Health checkups Parental coverage enter for industry leaders |
| IT / Software | Programming, SaaS / product, IT consultancy, systems integration and related information services. | · Credible GMC core to hire engineers and delivery leads · Parents and everyday care trail funded IT peers | · Peer vs funded IT · Parents as add-on · Default tele / checkups | Insurance · ESC · Maternity · GPA Healthcare · Telehealth Credible core for tech hiring |
Insurance · GMC (ESCP) · Maternity · Parents · GPA Healthcare · Telehealth Leaders match their median funded peers |
| Consulting | Management consulting, research & opinion, strategy / ops advisory, niche professional & technical services. | · Brand-safe lean stack for client-facing professionals · Wellness sometimes arrives before full ESCP | · Partner approval · Brand-safe family defaults · Light admin | Insurance · ESC · Maternity · GPA Healthcare · Thin at median Brand-safe professional floor |
Insurance · GMC (ESCP) · Maternity · Parents · GPA Healthcare · Telehealth Benefits that work for partners used to MBB benefits |
| Healthcare | Care providers, diagnostics, devices, digital / clinical health services, pharma / biotech services, healthcare BPO. | · Under-covers dependents · Family and everyday access still thin relative to the care brand. | · Parity with funded brands · Family + everyday access, not mega SI. | Insurance · ESC · Maternity · GPA Healthcare · Thin at median Protects staff less than patients |
Insurance · ESCP · Maternity · Parents · GPA Healthcare · Telehealth · Health checkups Coverage reflects the ‘care’ brand |
| Manufacturing | Transformation of materials into goods — process industries, fabrication, textiles, specialty equipment, industrial production. | · Occupational risk first (GPA high) · Family cover secondary | · GPA + GMC core · Shop-floor enrollment · Health Checkups | Insurance · ESC · GPA Healthcare · Thin at median Accident-first posture |
Insurance · ESCP · Maternity · Parents · GPA Healthcare · Telehealth · Health checkups Leaders invest in healthcare breadth |
| E-commerce / Retail | Specialty / D2C retail, e-commerce sellers and brand ops with high frontline headcount. | · High-churn shop-floor treated as a cost centre · Richer design reserved for managers. | · Cheap durable cover for associates · Richer manager tier | Insurance · ESC · GPA Healthcare · Thin at median Cost-centre floor |
Insurance · ESCP · Maternity · GPA Healthcare · Telehealth · Health checkups Quality benefits for top operators |
| Hospitality & F&B | Hotels, QSR / cafe chains, catering, cloud kitchens — attrition-heavy front-of-house and kitchen crews | · Frontline attrition resists family widening · local norms and tip-economy pay keep PPE lean | · High-churn enrollment · GPA + GMC · checkups as absenteeism control | Insurance · ESC · GPA Healthcare · Thin at median Frontline-lean |
Insurance · ESCP · Maternity · Parents · GPA Healthcare · Telehealth · Health checkups Brand hotels clear a fuller floor |
| Education | Schools, edtech, upskilling and learning delivery — faculty- and trainer-heavy workforces | · Faculty-friendly GMC optics · GPA often missing from the median stack | · Affordable optics · add GPA, then tele / checkups. | Insurance · ESC · Maternity Healthcare · Thin · GPA often missing Optics over protection |
Insurance · ESCP · Maternity · GPA Healthcare · Still thin · Health checkups Family upgrade before wellness |
| Marketing & Media | Creative / digital agencies, media houses, brand shops — project-based teams and thin permanent headcount | · Thinnest cover in the book · employee-only still common at the median. | · Lowest viable family upgrade (E → ESC + maternity) before wellness. | Insurance · E-only · GPA Healthcare · Thin Thinnest family design |
Insurance · ESCP · Maternity · GPA Healthcare · Still thin Lowest viable family upgrade |
Benchmarks
The previous section showcased different cohorts by appetite to invest, benefits stacks, and priorities. This section covers detailed benchmarks across common health benefits.
Companies in the financial services and consulting space offer better benefits than other industries.
Financial services and consulting firms offer the best benefits among all bootstrapped companies. These sectors hire credentialed, client-facing professionals whose compensation already sits above the Indian mid-market, and whose clientele (borrowers, corporates, HNIs, institutional buyers) expects a polished employer brand.
Benefits for these sectors are influenced by both higher earning power and a competitive talent market.
| Benefits | Financial Services | IT Software Solutions | Other Indian Companies |
|---|---|---|---|
| Sum insured >₹5,00,000 | 26% | 10% | 10% |
| Parental covers | 37% | 28% | 18% |
| Maternity covers | 62% | 63% | 47% |
| Progressive benefits | 6% | 6% | 2% |
| No sub-limits / copays | 70% | 71% | 52% |
| OPD wallets | 11% | 13% | 7% |
| Super Top-Ups | 6% | 2% | 1% |
| Group Term Life | 18% | 17% | 7% |
| Telehealth | 38% | 36% | 32% |
| Health checkups | 42% | 44% | 21% |
| Mental health support | 6% | 5% | 4% |
The impact of misaligned tradeoffs.
Companies in this cohort treat benefits as a cost centre, resulting in misaligned tradeoffs — defer parents, skip maternity, postpone telehealth, hold the sum insured at the floor. In the pursuit of saving a thin slice of per-employee premium, companies end up having to deal with disengagement, offer declines, and lower retention.
This table covers the gap between local Indian employers and funded and international peers across key benefits, the impact it has on employees, and attainable fixes.
| Benefits | Delta vs Peers | Spend | Impact | Fix |
|---|---|---|---|---|
| Parental coverage | 22% → 54% (−32 pp) | High | Parents often carry the household's real health risk, and little of their own cover. When the plan's coverage stops at the employee, families end up paying extensive out of pocket amounts. | Voluntary parental cover |
| Maternity | 53% → 84% (−31 pp) | High | Pregnancy without cover turns into a private financial shock. For hires in family-formation years, a missing maternity line reads as the employer stepping back from providing support. | Basic ₹50,000 maternity where the age band fits |
| Term life | 8% → 20% (−12 pp) | Low | Lower day-to-day salience than family or maternity, and easier to defer when cash is tight. The cost of that deferral is fine — until a household loses its earner with no safety net. | Defer if the budget is tight; revisit once coverage is improved |
| Telehealth | 38% → 59% (−21 pp) | Low | Skipping telehealth saves little premium and pushes minor illness into leave days, wait times, and higher claims incidence down the line. | Pay-per-use after a small free-consult allowance |
| Health checkups | 39% → 55% (−16 pp) | Low | Deferred diagnosis is expensive later. An annual check is cheap relative to the chronic claims the health insurance policy will eventually. | Free annual checkup with a follow-on diagnostic discount |
| Mental wellness | 6% → 14% (−8 pp) | Low | In knowledge and client-facing roles the cost of deferring mental health benefits shows up as disengagement and exits. | Pay-per-use access |
How do bootstrapped Indian companies compete for talent whose expectations are inflated by VC money and international organisations?
Companies in this cohort have the short end of the stick in attracting talent. They cannot compete on payroll — funded and international peers typically clear higher cash CTC, often by 20–40% for the same roles. They cannot compete on employer brand — those peers are already known and preferred. Benefits is the place where they can still level the field: health benefits are a fraction of payroll, and a stronger plan improves how the employer brand is felt in the offer.
Companies cannot afford to treat benefits as a cost item to trim at renewal; it is the highest-ROI path to parity on an uneven field. We illustrate the pathway of a median Indian business (₹5,00,000 sum insured, ESC family cover, basic maternity at ₹50k, ≈0.83% of total payroll) to a Holistic plan (healthcare suite, parental cover, maternity ₹75k, GTL, a 10% copay for responsible utilization; ~1.96% of payroll) that puts them in the top decile of their fellow businesses and at parity with their funded peers.
Stone Soup
Two travelers arrive in a village during a lean year and announce they can make soup from a stone alone. Curious, the villagers gather to watch. The travelers drop a stone into a pot of boiling water and taste it thoughtfully.
"Good," one says, "though it would be even better with just a little cabbage, if anyone happened to have some spare." Someone does.
"Now if only there were a bit of salted beef..." Someone has that too.
By evening the whole village has contributed something small, and there's a rich, genuine stew — made almost entirely of things that were already sitting in people's kitchens, unused, because nobody had organized a reason to bring them out.
Nobody in the village was missing ingredients. What they were missing was someone designing the moment that got each person to actually contribute theirs. A policy for this cohort usually works the same way — the health benefits are already available. What decides whether it becomes a meal is whether someone decided explain their context in the recipe.

MNC and GCCs
They invest more in employee health than their Indian peers.
This section covers multinational employers and their India captives — GCCs, R&D centres, delivery hubs, and country organisations that sit inside a parent with operations beyond India. They arrive for different reasons: to build product for the world with Indian talent, to run cost-efficient services at scale, or to treat India as a strategic market.
They invest more in employee health than their Indian peers. Median spend per employee is about 1.6× a funded startup and nearly 3× a bootstrapped Indian organisation; more than a fourth already put three or more healthcare benefits in addition to health insurance. The median international stack resembles the top quartile of Indian employers.
However, benefits strategies diverge. What a global company offers in India is influenced by why it has set up in the country. Product and R&D outposts compete for scarce engineering talent and run the most progressive plans — often the best in the country. Service hubs chase parity with local IT and BPM baselines and stay closer to bootstrapped Indian peers, especially at scale. Strategic and transformation hubs inherit a more institutional, parent-shaped bundle: complete on life and family cover, more conservative on how preventive care is delivered.
This section covers a plethora of themes: how far ahead the median global employer sits; how a median international stack compares to a top-quartile Indian one; the three India-intent archetypes and their benchmarks; how India benefits compare to global markets; and why more global benefits teams are now taking the standard set by Indian operators seriously — not only the mandate written at HQ.
Global companies blow Indian organisations out of the water.
Global companies setting up in India are raising the bar on employee healthcare — on insurance depth and on the breadth of primary, preventive, and emergency benefits beside it. Median spend per employee is about 1.6× a funded startup and nearly 3× a bootstrapped Indian organisation. More than a fourth of global employers already offer three or more healthcare benefits (telehealth, health checks, mental wellness, OPD, and the wider wellness set).
Almost half of MNCs and GCCs — 43% — sit as Holistic Leaders (deep insurance and meaningful healthcare breadth). International organisations raise the bar for all of India.
A median international company's healthcare stack is on par with the top-quartile Indian company.
Global companies do not only outspend the Indian median — their typical plan resembles the top quartile Indian employers (unicorns, legacy Indian organisations), and then pushes further on the healthcare products.
| Median MNC/GCC | Top-quartile Indian | |
|---|---|---|
| Insurance | ₹7,50,000 sum insured · ESCP · Maternity ₹1,00,000 · No copays / sub-limits · Group personal accident | ₹7,50,000 sum insured · ESCP · Maternity ₹75,000 · No copays / sub-limits · Group personal accident |
| Healthcare | Doctor consultations / telehealth · Annual health checkups · OPD · Mental wellness | Doctor consultations / telehealth · Annual health checkups |
| Read | Same deep insurance floor as top Indian peers — then OPD and mental wellness push past them | Insurance and core preventive care already clear a Holistic-leaning floor — everyday OPD and mental still the open ground vs global |
An international company's approach to benefits is influenced by why they're investing in India.
Top-quartile Indian employers already clear a deep insurance floor and core healthcare (telehealth + checkups). The median global plan is at par with the stack, then adds OPD and mental wellness — the layer that turns a strong healthcare policy into the international standard.
A global company's benefits stack is influenced by why it sets up shop in India — talent arbitrage for product engineering, cost arbitrage for services delivery, or a strategic bet with country P&L.
Product and R&D outposts over-index as Holistic Leaders. Service hubs sit closer to bootstrapped Indian peers. Strategic hubs inherit a more institutional bundle influenced by global headquarters — complete at scale and coverage, but thinner on adoption-led healthcare.
| Product / R&D outpost | Service hub | Strategic / transformation | |
|---|---|---|---|
| Profile | Product-engineering or innovation sites that tap Indian talent while global HQ still owns roadmap and brand. Rarely carry C-suite or country P&L — compete hard for product-grade engineers | Delivery centres for cost-arbitrated execution — IT services, BPM, shared ops. Site- or function-led; mandate is efficiency and scale. | India as a strategic market or transformation hub: leadership across functions, clear P&L, invest-and-expand mandate — not labour arbitrage alone. |
| Approach to benefits | World-class stacks to win scarce talent; small teams let them go deep without scale economics biting yet. 59% are Holistic Leaders. | Parity with local IT / BPM / consulting baselines — meet or slightly beat the Indian median. Compete more on ops and network; wellness is present but thinner. | Inherit the parent's institutional bundle. Strong on completeness (life, accident, family, progressive riders); preventive care more often via blanket OPD / wallet than point benefits. |
| Key decision maker | Site HR lead with global Comp & Ben sign-off | Site or function lead · Delivery head | India CHRO · Country leadership |
| Requirement | HRMS/HRIS-native admin; global + local benchmarks; privacy/security that clears international bars; delivery that matches FAANG-grade talent expectations. | HRMS/HRIS-native admin; global + local benchmarks; privacy/security that clears international bars; delivery that matches FAANG-grade talent expectations. | Global-mandate delivery + DEI / progressive covers; payroll-grade integrations; same international compliance bar as product hubs. |
| Median benefits stack | Insurance: GMC ₹10,00,000 · ESCP · Maternity ₹75,000 · GPA · GTL Healthcare: Telehealth · Health checkups · Mental health Health-wallet signature — parents + wellness; GTL optional |
Insurance: GMC ₹5,00,000 – ₹7,00,000 · ESCP · Maternity ₹50,000 Healthcare: Telehealth · Health checkups GMC-core — similar to Indian peers |
Insurance: GMC ₹7,00,000 – ₹10,00,000 · ESCP · Maternity ₹1,00,000 · GPA · GTL Healthcare: Telehealth · Health checkups · Mental health · OPD covers Corporate completeness |
| P95 benefit stack | Insurance: GMC ₹15,00,000 · ESCP · Maternity ₹1,50,000 · GPA · GTL Healthcare: Telehealth · Health checkups · Mental health · EAP Top benefits in the country |
Insurance: GMC ₹10,00,000 · ESCP · Maternity ₹75,000 · GPA Healthcare: Telehealth · Health checkups · Mental health · OPD cover GMC-core — parents often stop at ESC |
Insurance: GMC ₹7,00,000 – ₹10,00,000 · ESCP · Maternity ₹1,00,000 · GPA · GTL Healthcare: Telehealth · Health checkups · Mental health · OPD cover · EAP plans Corporate completeness |
Benchmarks — the three India-intent archetypes
What that spend buys — category by category — as a 0–100% mix for each group.
The overview ranked the three India-intent archetypes on spend. The landscape pages that follow unpack what that spend buys — category by category — as a 0–100% mix for each group.
Scaling Service GCCs still lead Indian peers on healthcare
When service-arbitrage captives scale, their insurance spend resembles bootstrapped Indian peers.
However, healthcare is where they still pull ahead. Mature service hubs are about twice as likely to carry telehealth (~73% vs ~33%) and nearly twice as likely to offer health checkups (~45% vs ~24%). Copay-free health insurance policies are more common too.
| Benefits | International Service Orgs | Local Indian Peers | Read |
|---|---|---|---|
| Sum insured >₹5,00,000 | 36% | 28% | Slight edge |
| Parental covers | 36% | 36% | Match |
| Maternity covers | 82% | 74% | Slight edge |
| No sub-limits / copays | 91% | 83% | GCC cleaner |
| Super top-ups | 9% | 4% | Rare both |
| Group Term Life | 18% | 24% | Indian edge |
| Telehealth | 73% | 33% | GCC leads |
| Health checkups | 45% | 24% | GCC leads |
Health benefits in India offer the best coverage for the investment.
On all three, India's top-decile plan is the most comprehensive when compared with leading global economies.
An employee health plan is determined by what the employee still pays once insured, who is on the policy, and what the wording excludes. On all three, India's top-decile plan is the most comprehensive when compared with leading global economies.
| India | USA | EU (DE/FR/NL) | UK | Singapore | Australia | UAE | |
|---|---|---|---|---|---|---|---|
| Benefits budget — share of payroll | ~2–3.5% · 2% typical · 13% PF · +4.81% gratuity | ~10–15% · 7% typical · +7.7% Social Security & Medicare | ~20–25% · 10–25% band · Germany employer health ~7.3% of gross | ~10–15% · PMI is ~1–2% of it · +3% minimum employer pension | ~12–15% · APAC 8–15% band · +17% CPF | ~12–15% · APAC 8–15% band · 12–18% superannuation | ~8–12% · Employer-paid health mandatory · +~5.8% end-of-service |
| Employee still pays — out of pocket | Nothing · No deductible · No copay or coinsurance · No room-rent limit · No waiting period | $1,200 deductible · Then 20% inpatient coinsurance · $30 primary · $50 specialist · $350 ER · Drugs $10–$250 by tier · OOP max $5k / $7.5k family | DE — $12/hospital day · $12–24 outpatient · $12–24 therapy; FR — $23 daily hospital charge · $9–12 outpatient · $8–12 therapy | Outpatient $27–$68/visit · Dental capped at $1,350 · Vision capped at $270 · Mental health | Inpatient $40–$590/day · Outpatient & specialist 10–20% co-pay · $9–32/visit · mental health $24–80 · Vision capped at $200 | Medicare gap payments · Hospital excess on the policy · Annual dollar limits on dental and vision | 10–20% inpatient copayment · Outpatient $27–$51/visit · Mental health $55–$217, partly covered · Dental ~$1,000 · vision ~$250 caps |
| Who is on the policy | Employee + spouse · Up to 4 children · 2 parents / in-laws · LGBTQ+ & live-in partners | Employee, spouse, dependent children · Employer funds 95% of employee premium, 70% for dependants | DE — dependants without income at no extra cost; FR — employer pays ≥50% of mutuelle (insurance) to family | Employee + dependants on private medical insurance | Employee · Dependants usually a paid add-on | Employee · Family cover as an upgrade | Employee mandatory · Nominal employee contribution towards dependants |
| Capped or excluded | Pre-existing covered from day one · Mental illness at parity with physical (IRDAI) · Real gap: OPD — bought separately | Deductible resets annually · Out-of-network at 40% coinsurance · Specialty drugs $250/script · Dental & vision 85% employee / 60% family | Crowns & orthodontics up to 50% patient share (DE) · Vision & most dental need supplementary layer | Pre-existing conditions excluded · Chronic disease support limited · Mental health & physio capped by sessions | Outpatient & specialist always co-pay · Dental limited · Chronic disease management capped annually | Waiting periods on extras · Employer premiums attract FBT at 47% | Mandated basic plan ~$88/employee · thin · Comprehensive upgrades $818–$2,750 |
| Top-quartile stack | Sum insured of ₹20,00,000 · No room-rent limits, deductibles, copays or waiting periods · Pre-existing from day one · Maternity ₹1.5–2 L · infertility, well-baby, well-mother covered · Gender affirmation, surrogacy, congenital, organ donor · Modern treatments · domiciliary hospitalisation · OPD ₹20k–₹50k · diagnostics, meds, mental health, vision, dental · EAP, checkups, telehealth, camps, gym · GPA & GTL ₹50 L or 3× CTC | Inpatient, outpatient, ER, primary & specialist · Preventive screenings, vaccinations, checkups · Prescription drugs · tiered copay · Paediatric, maternity, newborn · Mental health · substance-use treatment · Rehab · physio, OT, speech · Dental & vision · usually separate plans · Telehealth & wellness · Employer funds $7,034 of $8,435 single · $16,357 of $22,463 family | Statutory: hospital, GP, mental health, Rx, screening, rehab · DE — dependants free · employer ~7.3% of gross · FR — mutuelle closes 70–80% public gap · Mental health · substance-use treatment · NL — basic compulsory aanvullende for extras · Copays & deductibles on several lines | NHS base · PMI buys speed of diagnosis · Inpatient, surgery, overnight · Specialist consultations · MRI, CT, bloods · Cancer covered extensively · Mental health & physio capped by sessions · Dental & optical optional · Pre-existing excluded · chronic support limited | CPF Medisave base · employer supplements private care · Inpatient & surgery · up to 90% private / 100% government · Outpatient & specialist · 10–20% co-pay · Maternity · prenatal, delivery, postnatal · Chronic disease management · annual limits · Capped psychiatric / counselling sessions · Limited dental · eye exams · Group term life 1–5× salary | Medicare base · Private health A$1,500–4,000/employee · Super above 12% · 15–18% common in tech · Income protection · EAP · L&D budget · Employer premiums attract FBT at 47% | Employer-paid cover mandatory for private-sector foreign employees · Employer pays full or substantial share · Outpatient · specialists, diagnostics, Rx · Preventive checkups & vaccinations · Inpatient surgery · semi-private / private room · ER, ambulance, maternity, paediatric · Limited dental & vision |
The only plan in the world that includes parents.
It carries no deductible, no copay, no room-rent limit and no waiting period; it covers pre-existing conditions from day one; and it is the only plan in the world that includes parents.
It is also the most cost-effective, running at about 2% of payroll against roughly 15% in the USA, 10–25% across Europe and 8–15% across APAC. Treatments cost 60–90% less than in the US, Europe or Australia, so a global employer can widen coverage substantially for a very small increase in spend.
Global companies are warming up to the Indian standard of experience
A 150% increase in international companies initiating benefits conversations with local players.
Over the last three years, we've witnessed a 150% increase in international companies initiating benefits conversations with local players rather than strategic bankers and global partners.
The old status quo used to be global companies either working on a global mandate or with a banking consultant to set up benefits in India. Today, more organisations are not treating benefits as a run-of-the-mill checklist. Conversations now run across four vectors: adherence to local and global benchmarks, benefit admin operations, servicing for insurance claims, and healthcare as part of the benefits stack.
| Vector | Trend | Limitations with status quo |
|---|---|---|
| Adherence to local and global benchmarks | Buyers want a plan that works for the India talent market, calibrated to local norms, and built for Indian nuance like CTC-linked life cover, parents and in-laws as dependants etc. | Global-broker templates miss India-specific definitions, or import the wrong sample. Large-consultant benchmarks often sit on 1,000–2,000-life groups — not very relevant for a first India office of 20–30 employees. |
| Benefit admin operations | Enrolment, endorsements, CD balances and dependant approvals must run without a local benefits hire. The bar is an app a non-Indian people success team can administer. | Uniquely Indian paperwork and compliance — CD balances, post-enrolment dependant approvals — still has to get done. A five-person India team will not hire an admin just to wrestle the broker. |
| Servicing for insurance claims | Cashless, hospital access, and who helps the employee with a claim. Country heads want healthcare partners to work the employee. | Globally administered helpdesks sit a layer away from insurer and hospital. Benefits admin and claims experience have been antiquated in most markets. Legacy players lack local hospital and TPA relationships, route every endorsement through a chain, and were never built to work the claim with the employee on the ground. |
| Healthcare as part of the benefits stack | Insurance and healthcare are separate line items in India. Checkups, telehealth and care programmes are scoped with the policy, not after it — because access to care is part of day-to-day life. | RFQs often stop at the insurance line. Checkups, telehealth and care programmes stay as separate vendors — each with its own contract, login and standard of care — so the stack never consolidates into one healthcare journey. |
"Healthcare is deeply personal. We can't cater to everyone's individual needs — but what we can do is accommodate people's local needs. That's forcing companies to pick a local solution: a local broker with proprietary technology that can guide them through it. For a GCC or an MNC, that preference will in many cases supersede price."
— Nachi Bhatia, President, Bridgely

The new standard of
benefits is useless
without outcomes.
Bian Que's Brothers
A king asks his physician Bian Que, the most celebrated doctor in the country, which of the three brothers in his family is the best.
Bian Que says the eldest. He treats illness before it has taken any form, so the patient never knows he was ill and the brother has no reputation beyond the family.
The middle brother treats illness as it begins, while it is still small. People assume he cures minor complaints, and he is known in his own village.
"And I," says Bian Que, "treat disease when it is full-blown, with needles and knives and strong medicines, in front of everyone. That is why my name is known throughout the country, and why I am the worst of the three."
Primary and preventive healthcare benefits, care that stops an employee from a catastrophic admission has no claim, no line item and no story. Therefore, it is the easiest spend to cut and the last to be included. This chapter is about this cost, both tangible and intangible.
Benchmarks tell you what a strong plan looks like.
Experience and outcomes tell you whether yours is working.
Chapters 1 and 2 map the new standard — how India Inc's stack has deepened, where cohorts sit, and what Holistic Leaders actually buy. Those benchmarks are the right starting point. They are not the whole problem.
Every workforce carries its own prior: age mix, parental load, chronic risk, maternity calendar, claim concentration. A peer-median GMC can still fail a company whose top 5% of families already drive most of the ICR, or whose parents sit outside the network. Benchmarks solve for market posture. They do not solve for your pattern.
Building a plan that earns its keep therefore turns on two factors that sit beside the schedule. First, prior patterns in the workforce — who actually claims, which conditions write the loss ratio, where the prevention window is still open. Second, adoption and utilisation standards — whether people find the benefit, trust it, and use it at a healthy rate: too low wastes the cheque; too high without context is a risk signal, not a vanity metric.
Technology runs through both. One platform collapses the vendor maze into a single journey — context across insurance and healthcare, a consistent experience, and fewer compliance seams — so prior risk can be seen early and utilisation can be steered into detection → action → adoption → intervention loops. Without that operating layer, even a Holistic Leader stack stays a PDF.
This chapter is about closing that gap. We look at the unification of employee health driven by tech; the benefits that need to be on your radar next; and the service and adoption benchmarks you can use to measure whether the plan is effective — not only designed.
Piecemeal solutions to an integrated platform
Moving from piecemeal point solutions to a single integrated healthcare platform.
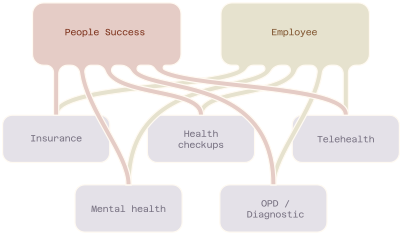
A benefits stack can look comprehensive on paper and still feel fragmented in practice. Insurance, health checkups, telehealth, mental health and OPD are often delivered by separate vendors — each with its own contract, workflow, login and standard of care.
The result is a vendor maze. Disjointed experience for HR and employees, no single source of data across the healthcare journey, and more privacy and compliance risk from working across multiple players.
The old way · A Vendor Maze
Each service has its own contract, app, data and operating model
The New Standard · One Healthcare Platform
Services share one experience, one data layer, and one standard
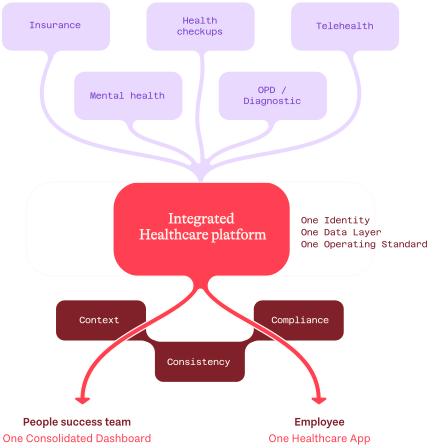
People success team
- Full context on workforce health risks
- Less admin, vendor coordination, and communication overhead
- Single source of truth and cleaner data
- Better impact measurement with fewer data-exposure surfaces
Employee
- One intuitive touchpoint for every healthcare need
- Consistency access to quality care
- Complete health loops: detect, consult, act, and follow up
- Longitudinal history and personalised support
The result: A single journey that turns benefits into outcomes. The same platform gives employees the continuity require to act on their health
The Three Cs of the employee healthcare experience
For a benefits stack to catalyze great health outcomes, three things matter: Context, Consistency, and Compliance.
- Context — Organizations offer different health benefits across primary, preventive, and emergency health. This data is often disjointed, which does not give both HR and employees a complete snapshot of their health. Therefore, HR cannot offer relevant benefits, and employees aren't equipped with enough information to make lifestyle changes.
- Consistency — When a health benefits stack is spread across multiple vendors, it is difficult to set the standard for experience. Different apps, means of data capture, and different standards result in too many variables influencing an employee's relationship with their company's health benefits.
- Compliance — Sensitive data is handled by multiple vendors, resulting in multiple operational hurdles, as well as increased exposure for data leaks and risks.
Healthy adoption of health insurance
What does healthy adoption of health insurance mean?
There are two ways to think about adoption of benefits. On one hand, organizations do not see adoption of health insurance because employees prefer their personal policies over the corporate policy – low awareness, a poorly designed policy, low trust in the experience etc. On the other hand, organizations could see exorbitant adoption – which could indicate anomalies and unaddressed health risks among the workforce.
These benchmarks on adoption will help you understand where your organization sits on this spectrum, and what you might need to do.
| Policy type | Warning signs if utilisation is low | Warning signs if utilisation is high |
|---|---|---|
| Employee only Median incidence rate: 5% |
Employees lean on personal policies · Low awareness of cover and other benefits. Fix: enrolment + app onboarding, published network list, first-claim concierge. |
Small base makes incidence noisy · Late-stage or catastrophic claims, possible adverse selection. Fix: review claim mix and SI adequacy, preventive checks before renewal. |
| Employee, Spouse, Child Median incidence rate: 8% |
Low awareness of cover and other benefits · Employees lean on personal policies. Fix: family onboarding at life events, cashless for dependents, OPD/primary bridge. |
Maternity and paediatric spikes · Undiagnosed chronic risk in the household. Fix: planned maternity pathway, family health checks, chronic care programmes. |
| Employee, Spouse, Child, Parent Median incidence rate: 17% |
Parents prefer local hospitals outside network · Unclear parental T&Cs and waiting periods · Low awareness of cover and other benefits. Fix: parental network education, clear SI/PED rules, dedicated parental desk. |
Parental morbidity lifts incidence and severity · Chronic/catastrophic concentration in the tail. Fix: parental SI/top-up design, chronic programmes for parents, early detection. |
5% of all employees use 88% of your total claimed amount.
Most of your people never touch the hospital policy in a given year. Only about 9% file a hospitalisation claim at all. Of the money that is claimed, almost all of it comes from a much smaller group. In FY26, the top 5% of employees (and their covered families) accounted for 88% of claim spend. The top 1% alone accounted for about 45%.
Employee-only (E) policies are the most extreme — the top 5% typically account for essentially all claim spend. The top 5% on an ESC policy make up about 91% of the total claims amount, and 72% on an ESCP policy. The concentration doesn't change much by team size, and adding dependants just spreads risk a bit further across the workforce.
A company's renewal premium is influenced by this small group, and not the median employee. While an underwriter might find this logic elementary, the writers of this report found it interesting. So we decided to analyse how employee health insurance claims stack up.
of employees file a hospitalisation claim at all in a given year
of FY26 claim spend came from the top 5% of employees and their covered families
of claim spend came from the top 1% alone
Which types of claims impact your Incurred Claim Ratio (ICR)?
We can group most health insurance claims into three categories — routine claims, chronic claims, and lightning strike claims — with each playing a different role. Routine claims are usually steady and are largely predictable. We observe chronic (NCD) claim spend rising about 22% over the last two years, impacting your ICR over time. Lightning strike claims contribute to volatility, especially if you have under 100 employees.
| Types of claim | % of total spend | Common conditions | Impact on ICR | How to plan benefits design |
|---|---|---|---|---|
| Routine | ~51% | Maternity & fertility · Infections / fever · Gastro Intestinal · Renal (non-CKD) · Cataract | Sets the ICR floor — shows up in most companies, every year | Treat as predictable volume · Design pathways and benefits across common treatments like maternity and cataract · Look out for deviations in infection/GI rates or average claims size |
| Chronic | ~34% | Cardio & stroke · Cancer · CKD / dialysis · Musculoskeletal conditions · Diabetes · Chronic respiratory | Drives ICR drift upward over renewals — fewer people, repeated / high-cost pathways | Invest in preventive health and early detection (checkups → consult → care loops) · Pair with SI depth, parent cover where relevant, and chronic pathways |
| Lightning Strike | ~9% | Trauma · Injury · Accidents | Drives ICR volatility — rare, but brutal in small pools | Attempt to absorb the risk through super and voluntary top ups, ambulance charges · Prioritise smooth cashless for trauma and accident cases · Introduce GPA |
*Note: ~6% of claims fall under misc. categories (pre/post, untagged etc)
Chronic conditions make up a third of the total claimed amount raised
Chronic conditions make up a third of the total claimed amount raised, a large chunk of which can be prevented with early detection and intervention. Chronic conditions account for about 34% of net-sanctioned spend. We explore the conditions below, across employees, spouses, children and parents.
| Condition | % of total claimed | Claims / Patient | Median cost / Patient | Impact on ICR |
|---|---|---|---|---|
| Cardiovascular Disease | 12.9% | 1–2 | ₹75,000 | Largest chronic ICR driver — often an acute event on a long risk runway |
| Cancer | 9.3% | 2–5 | ₹1,50,000 | High severity, multi-round chemo / admissions — putting pressure on SI |
| Musculoskeletal Conditions | 7.9% | 1–2 | ₹90,000 | High-volume early-onset pathway — volume, not severity, drifts ICR |
| Diabetes and Chronic Kidney Disease | 2.9% | 1–6 | ₹74,000 | Multi-round dialysis, co-morbid conditions, drifts ICR |
Prevention window for employees
Restricting these claims to employees and spouse only reveals an early onset of chronic disease. Hospitalization arrives in the early-to-mid 30s, a decade earlier than global peers. However, the risk manifests well in advance. Analysis of over 30,000 health checkups reveals that over 50% of employees are at risk of chronic disease well in advance. Early detection and intervention is essential.
| Condition | Median Age | Age 50% show risk | % of total E+S claimed amount | 3-yr spend growth | Median Burden / year |
|---|---|---|---|---|---|
| Cancer | 34 | NA | 4.0% | +81% | ₹2,50,000 – ₹4,00,000 |
| Cardiovascular Disease | 35 | 27 (8-yr window) | 6.1% | +5% | ₹1,25,000 – ₹2,00,000 |
| Diabetes and Chronic Kidney Disease | 36 | 31 (5-yr window) | 1.0% | +2% | ₹1,00,000 – ₹1,30,000 |
| Musculoskeletal Conditions | 31 | 29 (2-yr window) | 7.0% | +46% | ₹84,000 – ₹1,20,000 |
| Respiratory Conditions | 34 | NA | 0.1% | +0% | ₹21,000 – ₹51,000 |
Healthcare benefits and health outcomes
Investment in primary and preventive benefits have increased by 2.2× over the three years.
The share of organisations offering healthcare benefits rose from 22% in FY24 to 50% in FY26 (2.2×). Telehealth rose 2.1×, health checkups 5×, and mental health, OPD and dental/vision 5.5×.
Employees are also turning to their employers for support across preventive and primary healthcare — checkups, telehealth, mental health and OPD. First-time use is highest in mental health (74%) and annual checkups (61%). Dependents are coming onto the same stack — they account for 37% of doctor consults and 24% of OPD claims.
By doing so, employers are playing a vital role in complementing India's healthcare system.
| Benefits | First-time users |
|---|---|
| Annual Health Checkup | 61% |
| Gym membership | 31% |
| Mental Health | 74% |
| Benefits | Dependant share |
|---|---|
| Doctor Consultation | 37% |
| Annual Health Checkup | 31% |
| OPD Claims | 24% |
| Gym membership | 12% |
| Mental Health | 38% |
From diagnosis to improved health outcomes.
Thanks to employer investments in healthcare, early detection of chronic disease among adopters has improved by about 57%. However, detection only matters if it closes the loop. Today, employers that invest typically offer at least three healthcare benefits in addition to insurance. As a result, employees can use the company's healthcare benefits to complete health loops — from detection to intervention.
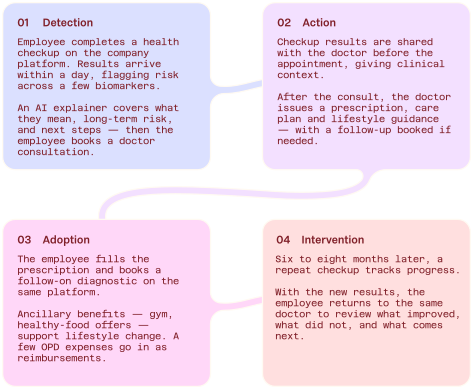
70% of repeat health checkup users have seen their biomarkers improve by a clinically significant value after employee-healthcare-driven adoption.
Investing in healthcare helps companies save up to ₹480 per employee.
When primary and preventive care catch chronic risk earlier, fewer employees progress into high-cost hospitalizations — and that influences loss ratios during a renewal.
Across 989 matched company pairs — organisations running both telehealth and health checkups, matched to non-benefit on coverage type, headcount, and premium per employee — chronic claim incidence runs about 13% lower at the median (p25–p75: 5–20%). On an E/ESC policy the stratum gap is larger (~24%), worth roughly ₹346 per employee of premium at renewal (p25–p75: ₹198–₹480). On an ESCP policy, where parents dominate the claims bill, the matched gap is smaller (~7%) — roughly ₹100 per employee.
While correlation does not equate causation, the size of the sample set and the patterns merit further discussions.
The chart below compounds that effect on chronic claimed amount per employee — growing ~6% a year. At the median programme effect, cumulative premium-effect savings can reach up to ₹1,171 per employee by year three.
Investments in healthcare spend shows up during renewal: on E/ESC, ~24% lower chronic incidence is worth ~₹346/employee (~₹100 on ESCP) — and compounds to ~₹1,171/employee by year three as claimed amount per employee grows.
Benefits on the radar
Benefits that need to be on your radar for the next few years, based on underlying claims and emerging trends.
Benefits on the radar, why they matter, and the new standard.
| Category | Why it matters | The new standard |
|---|---|---|
| Mother and child | 11.5% of claims and 10.4% of total claim spend · 69% of deliveries are caesarean, with median bill at ~₹1,00,000 · A ₹50,000 sub-limit is inadequate in almost every metro delivery | ₹1,25,000 single maternity limit — no normal/caesarean split · Newborn covered from day 1, up to family sum insured · Pre/post-natal ₹10,000, IPD and OPD, up to six months · IVF and infertility ₹1,00,000, outside the maternity limit · Surrogacy, MTP, well-baby and well-mother expenses covered · Child vaccinations ₹10,000 up-to age two, outside the maternity limit |
| Chronic disease | 34% of net-sanctioned spend · Risk is visible at 27, claims manifest at 35 — an eight-year prevention window · Cases above ₹5,00,000 make up 20% of total chronic spend | Pre-existing and named ailments covered from day 1, with no disease-wise sub-limits · Modern treatments — robotics, cyber-knife — up to full family SI · Oral chemotherapy and hormone therapy up to SI across IPD, OPD and day care · Day care per insurer list plus any new procedure that replaces a 24-hour admission · Enrolled pathway with a named case manager, triggered by the first flagged biomarker |
| Musculoskeletal and mobility | 7.9% of claimed amount; median ₹90,000 per patient · Claims at 31, risk visible at 29 — a two-year window · Employee and spouse spend up 46% in three years · Tail-end claims above ₹7,50,000 up 3.6× | Physiotherapy and rehab inside the OPD wallet, on prescription, with no admission trigger · Joint replacement and spine surgery with no disease-wise sub-limit and no implant cap · Arthroscopy, discectomy and similar treated as day care, exempt from the 24-hour rule · Screening from age 28, with a mobility and vitamin-D panel · Ergonomic assessment and workstation allowance for desk and hybrid roles |
| Mental health | 74% of mental-health users are first-timers · Mental health makes up a fifth of all telehealth consultations · Unaddressed mental health burden shows up through physical health pathways | Psychiatric cover up to full SI across IPD, day care and OPD · No separate waiting period, and no "recognised psychiatric unit" requirement · Psychosomatic and behavioural conditions named explicitly · Counselling for employees and dependents |
| Parents and elder care | Parental claims are 37% of net-sanctioned rupees · Median age 61; 49% of claims above ₹7,50,000 · P90 ₹4,36,000 vs ₹2,56,000 for employees · Senior citizens (60+) make up a tenth of the population, and the number will go up as India goes through its demographic dividend years | Parental cover as part of the total sum insured · Two parents or in-laws with cross-selection allowed · No parental co-pay · Age limit to 90 · No disease-wise sub-limit on cataract, joints or dialysis · Home healthcare and post-discharge nursing on voluntary cost-share |
| Catastrophic and tail cover | Top 5% of claimants take 28% of rupees; top 10% take 43% · Claims above ₹5,00,000 recover only 47% of total amount · P95 cases for cancer, CVD exceed ₹20,00,000 | Voluntary top-up options ₹1,00,000 to ₹15,00,000 on a ₹5,00,000+ base · Corporate buffer sized on trailing three-year claims, usable for non-critical ailments too · Critical illness ₹20,00,000 standalone |
| Life and accident cover | Trauma is 2.9% of total claimed amount; median age 33; 47% under 35 | Group term life ₹50,00,000, issued with no medicals · GPA ₹25,00,000 for permanent total, permanent partial and temporary disablement, not death alone |
| Health checkups and screening | 34% of screened employees carry a cardiometabolic flag · Median age 30 — 20% at 18–29, 69% at 50–70 · OSH Code: checkups mandatory above 40 | Annual checkup for every covered member, not the employee alone · Age- and risk-banded panels rather than one template for the whole company · A booked doctor consultation within seven days of any flag, with repeat markers at 6–12 months |
| Primary and everyday care | Dependents are 63% of consults | OPD wallet ₹10,000–₹20,000 per family — consults, diagnostics, pharmacy, dental and vision on prescription · Unlimited telehealth for employee and dependents · Pharmacy within the wallet — up to 10% of OPD, 100% for cancer medicines · Diagnostics and specialist consults on prescription, same wallet |
| Progressive and inclusion covers | Gender affirmation: market cost ₹2–15 L · Autism: 0.45 per 1,000 in claims vs childhood prevalence nearer 13 · Genetic disorders P90 ₹6,00,000; organ donor P90 ₹5,20,000 | LGBTQ+ partners and live-in partners covered as dependents · Adopted children addable on the enrolment cycle; up to 2 dependent siblings to age 25 where the employee has no children · Differently-abled children with no upper age limit · HIV and AIDS up to full SI; gender affirmation at 0% copay · Autism and genetic disorders named up to SI · Organ-donor medical expenses up to SI |
"When it comes to treatments like IVF – people are not comfortable talking about whether they need that benefit. It's possible that only a small section might utilize it. However, I know the kind of lifestyle and the statistics that the industry offers. I know that a lot of people need it, which is why it's important to include it in your benefits package. Even if it makes a difference with a small percentage of employees, it would be worth the investment."
— Monika Gunalan, Head of People (APAC), Postman
Benefits for the tail, not just the median employee
Healthcare needs to be truly accessible to be truly impactful. Benchmarks that only look at incidence, claim size and benefit cost can miss the outliers — the late-stage cancer patient who needs critical illness cover, couples blocked by infertility costs, or a young employee with a psychosomatic disorder.
Benefits that look insignificant in incidence trends can still define whether a policy is progressive. The chart below is directional, built from 500,000+ claims over three years — use it after you benchmark, to catch what the median view would skip.
The new standard of health benefits experience
Global standards, built from India.
Experience is the operating system of adoption. Speed, seamlessness, value and ease — on insurance and on primary care — are what turn a designed stack into used care.
A benefits stack is only as good as the experience that delivers it — score insurance and primary care the same way, and design to ensure the median is met.
| Bucket | Metric | Median | P90 |
|---|---|---|---|
| Speed | Cashless (TAT) | 47 mins | 78 mins |
| Speed | Reimbursement (TAT) | 1.5 days | 4 days |
| Seamlessness | Claims processed with ≤1 support interaction | 78% | 61% |
| Ease | Time to file a reimbursement claim end-to-end | 3 mins | 12 mins |
| Experience | Claims NPS | 79 | 74 |
| Bucket | Metric | Median |
|---|---|---|
| Doctor consultations | Repeat usage | 51% |
| Doctor consultations | Consult CSAT | 97 |
| Mental health | Repeat users | 82% |
| Mental health | Repeat sessions per patient | 7 |
| Mental health | Consult CSAT | 95 |
| Health wallet / OPD | TAT | 10 mins |
| Health wallet / OPD | Rejection rate | <5% |
| Health checkups | Health checkup NPS | 4.8/5 |
| Health checkups | Network coverage | 75,000–1,00,000 pincodes |
Conclusion
As we worked on this report, we realised that The Standard of Benefits was not just math or a compilation but a nuanced study on how organisations value and invest in talent. How leaders perceive and evaluate benefits is closely correlated with how they think about the value of their teams and how they would like to treat them.
Employee benefits – of which health benefits tend to be a sizeable chunk – aren't sexy perks. Neither are they a material chunk of any organization's P&L. It is 2026, and the vast majority of companies continue to spend under 2% of total employee compensation on benefits. Despite best efforts, it is very difficult to draw a 1-1 correlation between great health benefits and productivity, savings, and other measurable metrics, which was why it is convenient to write them off as a cost item, an item on a checklist you cross off once a year.
However, the impact of great benefits is very real and most people success teams that truly care, do understand this. How do you measure the reaction of a candidate with ageing, uninsured parents to a comprehensive insurance plan, a diabetic VP signing up for an chronic care program, a top performer hitting their goals thanks to their therapist's support, or the sales head not missing an important meeting because they spoke to a paediatrician about their kid's cold the previous night? The companies that get this are silently widening this gap over the rest. The potential reward vs. the cost incurred is truly asymmetric.
This topic of conversation was relevant under normal circumstances. This is even more relevant today. AI has put the entire labour market into a chaos tunnel. While nobody knows what the world will look like in the next three years and how the relative weights of capital, labour, productivity and so on will settle, we're seeing early trends.
AI-native teams have become the most prized possession across almost all organisations.
"AI talent" and the teams they are part of form a fraction of the workforce. However, this talent seems to have the privilege of choice, and companies are going out of their way to attract them. It will get increasingly harder to compete through objectives — salaries, ESOPs and bonuses will all start to converge in a race to the bottom. So much so that we already see companies employ every other tangible and intangible benefit at their disposal to move the needle. It could be as overarching as "purpose" for some but for most, it is boiling down to a hard relook of the basics. Organisations that understand the asymmetric, albeit intangible, returns on employee benefits will silently out-price their competition. And while decisions are not made solely on the back of great benefits, they can certainly help tilt the scales. If nothing else, they present an area where every organisation can stand shoulder-to-shoulder with the very best.
Organisations will have to care for their teams.
On the flip side, AI has also unnerved talent. Not only has the fear of AI-related layoffs become dinner-table conversation, but so has the added stress of increased expectations on productivity and outcomes. In these challenging circumstances, companies that are intentional about the care they provide to their teams are more likely to see those teams actually hit those ambitious goals without breaking the company culture.
Do your benefits reflect your talent density?
Organizations have become more mindful of headcount. Influenced by ZIRP-era trauma and developments in AI, employers are scaling outcomes with a clear mandate to do so without scaling their team size. This means two things: the median employee is more productive and likely, more talented, and per-employee budgets have the potential to increase. As companies attempt to increase the density of what they call "10× employees", they need to ask themselves if their benefits stack they had is at least keeping pace, even if it is not aiming to be as ambitious.
The world has become smaller and everyone has a genius working for them
A leading unicorn recently added infertility cover because an employee sent them a ChatGPT screenshot of their international competitor's health benefits policy. Talent is holding companies to the highest standards, and all data and information around benefits is only an LLM search away. If anything, questions will get harder and expectations will only go up.
The times are unprecedented (for real this time)
The democratisation of intelligence is having numerous direct, short-term effects as well as innumerable indirect, longer-term effects. The next few years will impact the next decade, if not the next century. The biggest impact will be seen in labour markets around the world. We will all think about the numerous possibilities unlocked and stress over the many, many dangers.
Perhaps, we can all take a moment to care.
Research and methodology
15,312 benefit plans · 5,20,100 claims · 74,543 checkups.
This report draws on Plum's FY26 employer-benefits book and matched claims and checkup feeds, with secondary market research for context. Cohort assignment is exclusive: MNC / GCC first, then funded startup, else bootstrapped Indian.
| Cohort | Plan-years FY22–FY26 |
|---|---|
| Funded startups | 24% |
| MNC / GCC | 18% |
| Bootstrapped Indian | 58% |
| Total | 100% |
| Relation | Share |
|---|---|
| Employee | 69% |
| Spouse | 22% |
| Parent | 9% |
| Relation | Share of claims | Share of net spend |
|---|---|---|
| Employee (E) | 27% | 27% |
| Spouse (S) | 22% | 19% |
| Child (C) | 14% | 10% |
| Parent (P) | 37% | 44% |
| Total | 100% | 100% |
| Source | Used for |
|---|---|
| IRDAI Handbook FY25 | Insured lives, group-health CAGR, premium as % of GDP |
| Swiss Re / OECD | Peer-country health-premium GDP shares |
| PIB · labour codes (notified 21 Nov 2025) | ESIC expansion; OSH Code checkups for workers 40+ |
| Zinnov–NASSCOM / Zinnov GCC | Funded ecosystem and GCC hub archetypes |
| Plum, Benefits Beyond Borders 2025 | Cross-country benefits stacks and payroll shares |
| BLS ECEC · ATO · CPF · UK auto-enrolment | Statutory employer loads by market |
| GPTW · LinkedIn Top Startups · Fortune / Forbes India | Illustrative 2% Club peer set |
About
Plum is creating the new standard of employee benefits. Backed by marquee investors like Peak XV and Tiger Global, the company has helped India's best companies like Eternal, Atlassian, CRED, and Twilio with their health insurance and employee benefits.


Driving great health outcomes for India's greatest talent
Thoughtfully designed insurance plans that cover your team and everyone they hold dear.
Inclusive, customisable, and affordable plans to protect your team and their family's well-being.
Financial protection against accidents leading to hospitalisation, death, and disabilities.
Provide financial protection to employees' families in the event of an untimely death.
High-quality virtual healthcare for you and your loved ones. Experience seamless primary healthcare in under 10 minutes, all from the comfort of your home. From booking to prescriptions, we've got you covered.
A modern, in-depth assessment of your key health metrics, designed to provide a clear path to better health.
Interactive, intuitive, and non-invasive health camps designed for employees, delivered across six zones covering fitness, screenings, ageing, counselling, and relaxation — making preventive care engaging and accessible in the workplace.
An exclusive suite of offers from India's best health and wellness brands. Curated offers across personalized stacks including women's health, nutrition and fitness, self-care, family care and more.
Individual term life and health insurance from Tier-1 insurers tailored for employees of Plum's partner companies, and their families.
Trusted by over 5000 companies and 6 lac users.
Crafted with care by the team at Plum
| Ganapathi Ramanathan | Content |
| Shriram Rajakumar | Design |
| Jose Benny | Founder's Office |
| Akshay Golechha | Chief Business Officer |
| Shreyas Achar | Chief Marketing Officer |
| With inputs from | |
|---|---|
| Prayat Shah | Head of Healthcare |
| Abhishek Poddar | Co-founder and CEO |
| Saurabh Arora | Co-founder and CTO |

The Standard of Employee Benefits 2026–27 · Plum · Made with care in Bengaluru
Glossary
Every insurance and benefits term used in this report, in plain English — with what it means in this report specifically.
70 of 70 termsIndia's traditional systems of medicine — Ayurveda, Yoga & naturopathy, Unani, Siddha and Homeopathy — which group policies can cover as an alternative to allopathic treatment.
Widely covered: 86–96% of plans across cohorts include AYUSH treatments.
The full set of health benefits a company offers — insurance policies plus healthcare benefits like telehealth, checkups and OPD — viewed as one layered package.
The report's central object of study: a top-quartile 2023–24 stack is barely the median stack today.
Measurable indicators of health — blood sugar, cholesterol, vitamin levels and the like — captured in lab tests during a health checkup.
Checkup plans cover 85–150 biomarkers; 70% of repeat checkup users saw a clinically significant improvement in deranged biomarkers.
Companies that are neither venture-funded nor multinational captives — NBFCs, IT services firms, manufacturers, retailers, schools, hospitals and the like, funded by their own revenue.
58% of the 15,312 plans studied. Their benefits investment is about half a funded startup's and a third of an international company's.
Compound annual growth rate — the steady yearly growth rate that would take a value from its start to its end over a period.
Median health-benefits investment per employee grew at 14.7% CAGR over three years; group health insured lives are growing at 23% CAGR.
A hospital claim where the insurer settles the bill directly with the hospital, so the patient pays nothing upfront (available at network hospitals).
Median cashless approval turnaround on Plum is 47 minutes (P90: 78 minutes).
Long-running, non-communicable diseases — diabetes, cardiovascular disease, cancer, kidney disease, musculoskeletal conditions — that recur and drive repeated claims.
~34% of claimed spend, growing 22% over two years. Hospitalisation arrives in the early-to-mid 30s in India — a decade earlier than global peers.
The pattern where a very small share of members accounts for most of the money claimed on a group policy.
In FY26 the top 5% of employees (and covered families) accounted for 88% of claim spend; the top 1% alone took ~45%.
Health conditions present from birth, historically excluded by insurers and now increasingly covered in progressive group plans.
Covered in India's top-quartile stack alongside surrogacy, gender affirmation and organ-donor expenses.
A fixed percentage of every claim that the employee pays out of their own pocket, with the insurer covering the rest.
No-copay plans are the norm (67–90% across cohorts); adding a 10% copay trims plan cost by ~7 index points and nudges responsible utilisation.
An extra shared pool of cover the employer holds beyond individual sums insured, drawn on when an employee's own cover runs out.
The new standard sizes the buffer on trailing three-year claims and makes it usable for non-critical ailments too.
A policy that pays a lump sum on diagnosis of a major illness such as cancer or stroke, regardless of actual hospital bills.
A standalone ₹20,00,000 critical illness cover is the report's new standard for catastrophic risk — P95 cancer/CVD cases exceed ₹20,00,000.
Cost to Company — an employee's total annual compensation package. Life and accident covers are often set as a multiple of it.
2% Club GTL runs at 2–4× CTC; a full top-decile benefits plan costs about 2% of CTC.
Treatments like cataract surgery or chemotherapy that need hospital facilities but not a 24-hour admission, covered without the usual overnight-stay rule.
The new standard covers the insurer's day-care list plus any new procedure that replaces a 24-hour admission.
The amount a patient must pay before insurance starts paying; coinsurance is the percentage share the patient still pays after that.
India's top-decile plan has no deductible at all — versus a typical US plan's $1,200 deductible plus 20% inpatient coinsurance.
Cover for hospital-grade treatment taken at home, when the patient cannot be moved or no hospital bed is available.
Part of the top-quartile Indian benefits stack.
Employee Assistance Programme — a confidential counselling and support service employees can use for mental health, stress and personal issues.
Appears in the P95 stacks of product/R&D outposts and strategic MNC hubs.
The report's 2×2 map of employers: the horizontal axis scores insurance depth (sum insured, family cover, maternity), the vertical axis healthcare breadth (benefits beyond insurance). Every employer lands in one of four quadrants.
15,000+ companies mapped on it; the market is migrating to the top-right, with Holistic Leaders rising from 5% (FY23) to 23% (FY26).
Employees' State Insurance Corporation — India's statutory health insurance scheme for lower-wage workers, funded by employer and employee contributions.
The new labour codes (notified 21 Nov 2025) expand ESIC coverage.
Shorthand for elite employers: FAANG for big-tech (Meta, Apple, Amazon, Netflix, Google) and MBB for the top strategy consultancies (McKinsey, BCG, Bain).
Mature startups benchmark their benefits against FAANG/MBB because they compete with them for the same talent.
Who a group policy covers: E = employee only; ESC adds Spouse and Children; ESCP adds Parents (sometimes with in-laws swappable).
ESCP adoption runs from 47% at early startups to 85% at strategic MNC hubs. Parents file 37% of claims and take 44% of net spend.
A model where each employee gets a fixed benefits budget and picks options (parent top-up, fertility, critical illness) beyond a non-negotiable core, instead of one identical plan for everyone.
As they scale, Holistic Leaders across all segments converge to flex. The report warns to build it in increments over renewals, with a protected insurance + preventive core.
Global Capability Centre — an Indian arm of a multinational running technology, R&D or operations for the parent company.
The MNC/GCC cohort is 18% of plans studied; 43% are Holistic Leaders, and their median spend per employee is 1.6× a funded startup and ~3× a local Indian business.
Group Medical Cover — the employer-bought health insurance policy that pays for employees' (and covered family members') hospitalisation.
The core of every stack. Median GMC sum insured is ₹5,00,000; 2% Club medians run ₹10–30 lakh.
Group Personal Accident cover — pays a lump sum for accidental death or disability of an employee.
Adding life/accident cover is up 179% since FY22. The new standard: GPA of ₹25,00,000 covering permanent and temporary disablement, not death alone.
Group Term Life — employer-bought life insurance that pays the employee's family a lump sum on death from any cause.
The median organisation now carries GPA and GTL together. New standard: GTL of ₹50,00,000 issued with no medical tests.
A periodic preventive screening — typically an at-home blood panel plus vitals — that flags health risks before symptoms appear.
Adoption grew 5×; 61% of users are first-timers; early detection of chronic disease improved ~1.5×. The OSH Code makes checkups mandatory above age 40.
The report's cycle of care: detection (checkup) → action (doctor consult) → adoption (prescription, diagnostics, lifestyle) → intervention (repeat checkup to verify progress).
Multiple benefits on one platform close the loop: 70% of repeat checkup users saw clinically significant biomarker improvement.
The top-right EB matrix quadrant: employers with both deep insurance and a real healthcare layer beyond it.
23% of employers in FY26, up from 5% in FY23. Among MNCs/GCCs, 43% qualify.
Incurred Claim Ratio — claims paid divided by premium collected. Insurers use it to price the next renewal; a high ICR means premiums rise.
Routine claims (~51% of spend) set the ICR floor, chronic (~34%) drift it upward, lightning-strike (~9%) add volatility. The report predicts healthcare products will move to ICR-style billing.
The share of covered members who actually file a claim in a year.
Only ~9% of employees file a hospitalisation claim. Median incidence: 5% on employee-only, 8% on ESC, 17% on ESCP policies.
The bottom-right EB matrix quadrant: deep insurance (high sum insured, family cover, maternity) but little healthcare beyond it.
Still the largest quadrant at 36% in FY26 (down from 49% in FY23).
In-patient department — care requiring hospital admission, the classic territory of health insurance (as opposed to OPD).
Top stacks now cover mental health IPD up to the full sum insured.
Insurance Regulatory and Development Authority of India — the government regulator for the insurance industry.
IRDAI FY25 data: ~58 crore health-insured lives (under 40% of the population), premiums just 0.36% of GDP. IRDAI mandates mental illness be covered at parity with physical illness.
Cover for fertility treatments such as in-vitro fertilisation, historically excluded from group policies.
Offered by 9% of early startups up to 42% of R&D hubs. New standard: ₹1,00,000 for IVF and infertility, outside the maternity limit.
The economic observation that making something cheaper or easier to use increases total consumption of it rather than reducing it.
One-app, cashless, tap-to-consult access lifts benefits utilisation past priced assumptions — a good problem, but the report says to budget for the healthcare spike.
India's consolidated labour laws, including the Occupational Safety and Health (OSH) Code, which reshape employer obligations on worker welfare.
Notified 21 Nov 2025; they expand ESIC coverage and the OSH Code makes health checkups mandatory for workers above 40.
Indian number units: 1 lakh = 100,000 (₹5,00,000 is written ₹5L), 1 crore = 10 million.
Median sum insured is ₹5,00,000 (₹5 lakh); India has ~58 crore health-insured lives.
Rare, unpredictable, high-cost claims — trauma, injuries, accidents — that hit without warning.
~9% of claim spend, but they drive ICR volatility, brutally so in companies under 100 employees. Fix: top-ups, smooth cashless for trauma, and GPA.
Claims paid as a share of premium — the insurer's measure of whether a group is profitable. It drives renewal pricing.
Chronic conditions write the loss ratio over time; companies investing in healthcare show ~13% lower chronic claim incidence, worth up to ₹480/employee at renewal.
The sub-limit within a group policy for pregnancy and delivery costs, usually far below the overall sum insured.
Limits above ₹75,000 are up 155% since FY22. With 69% of deliveries caesarean at a ~₹1,00,000 median bill, ₹50,000 is inadequate in metros; the new standard is ₹1,25,000 with no normal/caesarean split.
Percentile language: the median is the middle value; P90/P95 is the level only the top 10%/5% exceed; top quartile and top decile are the best 25% and 10%.
The report contrasts the median organisation with P95 'top-of-book' stacks — and finds today's median already matches 2023–24's top quartile.
Multinational corporation — a company headquartered abroad operating in India through subsidiaries or capability centres.
MNCs and GCCs offer the country's best benefits: median spend per employee is 1.6× a funded startup and nearly 3× a local Indian business.
Newer medical procedures — robotic surgery, cyber-knife, oral chemotherapy, immunotherapy — that insurers historically capped or excluded.
Top stacks cover modern treatments up to 100% of sum insured; most plans still apply copays or sub-limits to them.
Medical Termination of Pregnancy — abortion cover under the group policy.
Covered by 3–31% of employers depending on cohort; part of progressive mother-and-child design.
A hospital empanelled with the insurer or TPA where treatment can be cashless; outside the network, employees must pay and claim reimbursement.
Parents preferring local non-network hospitals is a classic cause of low utilisation; Plum's checkup network spans 75,000–1,00,000 pincodes.
Net Promoter Score — a satisfaction measure from −100 to +100 based on how likely people are to recommend a service. (Used only in this sense in the report.)
Plum's claims NPS is 79. The report also ranks perks by the NPS hit of trimming them — health, meals and L&D score high; lifestyle stipends low.
Out-patient department — everyday care with no hospital admission: doctor visits, diagnostics, pharmacy, dental, vision. An OPD wallet is a fixed annual allowance for these expenses.
OPD is 'the real gap' in Indian plans — bought separately. New standard: an OPD wallet of ₹10,000–₹20,000 per family; dependants file 24% of OPD claims.
Healthcare costs a person pays themselves because no insurance or benefit covers them.
Employer healthcare investments save employees more than ₹10,000 a year in out-of-pocket spend.
Product–market fit — the point where a startup's product demonstrably meets real demand, after which it shifts from searching to scaling.
Startups buy benefits deep early, optimise as they scale post-PMF, then rebuild comprehensively after a Series C+ raise.
In this report, per-employee spend — the benefits or premium cost divided by headcount (not protective equipment).
A fundraise lifts median benefits PPE ~35% within one renewal cycle; median healthcare PPE reached index 231 in FY26 (FY23 = 100).
A condition the member already had before the policy started. Retail policies usually impose waiting periods on these; good group policies do not.
Indian top-decile plans cover pre-existing conditions from day one — unlike, say, UK private medical insurance, which excludes them.
The idea that a successful preventive programme looks like money wasted, because its success is the absence of visible events.
The report opens with it via Fudai's 'too tall' tsunami wall: the peak of a successful preventive health programme looks like nothing happening at all.
Inclusion-focused benefits beyond the traditional policy: IVF, surrogacy, gender affirmation, autism, HIV/AIDS, organ-donor costs, LGBTQ+ and live-in partner cover.
Offered by 63% of R&D and strategic MNC hubs versus 13% of bootstrapped firms; the report calls them the mark of a genuinely progressive policy.
A claim where the patient pays the hospital first and the insurer repays them afterwards — the alternative to cashless.
On Plum, filing takes a median 3 minutes end-to-end and reimbursement turnaround is 1.5 days (P90: 4 days).
A cap on the hospital room's daily rate. Choosing a costlier room doesn't just cost the difference — it can proportionally shrink the entire claim payout.
No-limit plans reach 73% among strategic MNC hubs, while sub-₹5k caps are still common in bootstrapped plans. Top-decile plans have no room-rent limits.
Named rounds of startup venture funding, from pre-seed and seed through Series A, B and C+ as the company matures.
A raise lifts benefits PPE ~35% within one renewal cycle — 48% for Series C+ rounds. The 'we'll fix benefits after the next round' myth gets its own essay.
The bottom-left EB matrix quadrant: a focused, basic plan — a clear GMC core covering the essentials without much beyond it.
Down from 43% of employers in FY23 to 23% in FY26 as companies deepen and broaden.
A cap on what the policy pays for a specific treatment or category (cataract, joints, maternity), sitting inside the overall sum insured.
'No disease-wise sub-limits' is the new standard — especially on cataract, joint replacement, dialysis and psychiatric care.
The maximum amount an insurance policy will pay in a policy year, shared across the covered family on a floater plan.
₹5,00,000 is the median group sum insured; plans above ₹5L grew 53% since FY22, and 2% Club medians run ₹10–30 lakh.
Turnaround time — how long a process takes end to end.
Median TATs on Plum: cashless approval 47 minutes, reimbursement 1.5 days, OPD wallet claims 10 minutes.
Doctor consultations by phone or video — GPs and specialists on demand, without a clinic visit.
Adoption up 2.1×; dependants take 37% of doctor consults. New standard: unlimited telehealth for employees and dependants.
The report's name for employers who put roughly 2% of total payroll into employee health benefits.
Once aspirational, now common practice: GPTW-certified employers, LinkedIn Top Startups and Fortune 500 India units routinely hit ~2%, versus ~10% in developed markets and a historic Indian norm of 1.3–1.6%.
Extra insurance that starts paying after the base sum insured is exhausted. A super top-up counts all claims in the year toward its threshold, not just one big claim.
Still rare — 1–6% of bootstrapped firms. New standard: voluntary top-ups of ₹1,00,000–₹15,00,000 on a ₹5,00,000+ base, since claims above ₹5,00,000 recover only 47% of costs.
Third-Party Administrator — the intermediary that processes claims and runs cashless approvals between insurer, hospital and employer.
Legacy global brokers 'lack local hospital and TPA relationships', one of four reasons MNCs are switching to local partners.
A benefits setup where insurance, checkups, telehealth, mental health and OPD each come from a separate vendor with its own contract, app and login.
The report's 'old way', versus one integrated healthcare platform with one identity, one data layer and one operating standard.
Parent health cover offered as an opt-in that employees partly or fully pay for, rather than a fully employer-funded benefit.
The report's fix for the 32-pp parental coverage gap at local businesses; co-funded parents add +11 cost-index points versus much more when fully employer-paid.
A stretch after the policy starts during which certain conditions (maternity, pre-existing diseases, specific surgeries) are not yet covered.
Top-decile Indian plans have no waiting periods; unclear parental waiting periods are flagged as a classic cause of low utilisation.
The top-left EB matrix quadrant: employers investing early in healthcare breadth (prevention, primary care) while their insurance layer is still maturing.
18% of employers in FY26, up from 4% in FY23.
Zero interest-rate policy — the cheap-capital era of the 2010s and early 2020s that fuelled aggressive hiring, whose reversal made companies headcount-cautious.
'ZIRP-era trauma' is cited as a reason employers now scale outcomes without scaling team size — raising per-employee benefit budgets.